
When you receive laboratory test results, the numbers often come with reference ranges that indicate whether your values fall within "normal" limits. However, understanding the distinction between normal and optimal lab values can fundamentally change how you approach your health management. The concept of normal versus optimal lab ranges represents a critical gap in healthcare that affects millions of people who receive test results marked as "normal" yet continue experiencing symptoms or suboptimal health.
How Laboratory Reference Ranges Are Established
Laboratory reference ranges follow a standardized statistical methodology that relies on population-based data rather than individual health outcomes. The process involves collecting blood samples from hundreds or thousands of individuals who are assumed to be healthy, then analyzing the results to establish what constitutes "normal" for that population.
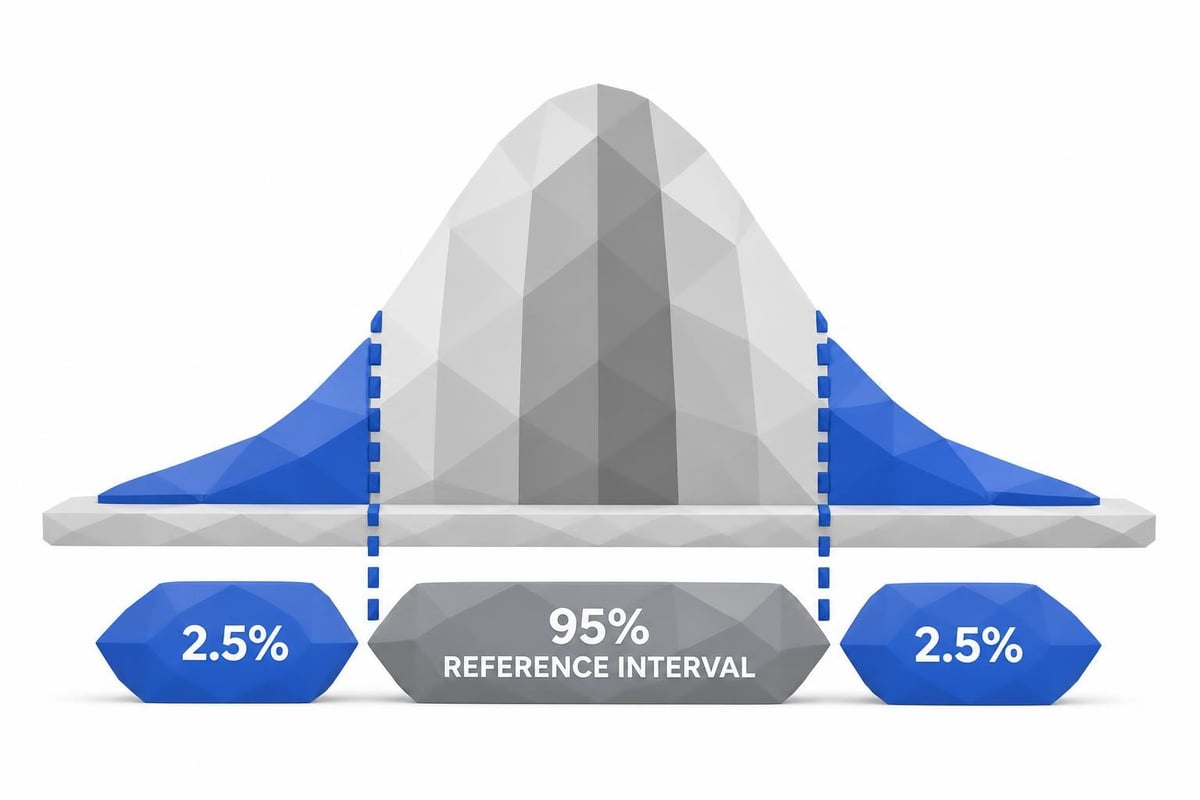
The traditional approach uses statistical bell curves to determine reference ranges. Laboratories typically exclude the top 2.5% and bottom 2.5% of values, meaning the middle 95% of the population defines the normal range. This methodology, while scientifically sound from a statistical perspective, creates several important limitations.
Key factors influencing reference range creation:
- Geographic location and local population demographics
- Age distribution of the reference population
- Gender-specific variations in biomarkers
- Laboratory equipment and testing methodologies
- Seasonal variations and time of day for sample collection
Understanding reference ranges requires recognizing that these values represent statistical averages rather than individualized health targets. A person can fall within the normal range yet still experience symptoms or health concerns that warrant further investigation.
The Statistical Foundation of Normal Ranges
Statistical normality does not equate to optimal health. When laboratories establish reference ranges, they typically sample from the general population, which increasingly includes individuals with undiagnosed conditions, suboptimal nutrition, sedentary lifestyles, and chronic stress. The reference population may include people who appear asymptomatic but are not necessarily thriving.
This creates a paradox: as population health declines, "normal" ranges may shift to accommodate increasingly unhealthy values. A biomarker that falls within the normal range today might have been considered borderline or concerning several decades ago.
Defining Optimal Lab Ranges
Optimal lab ranges represent values associated with the lowest risk of disease, best functional outcomes, and highest quality of life based on longitudinal research and clinical outcomes. Unlike normal ranges derived from statistical averages, optimal ranges emerge from evidence-based studies tracking health outcomes over time.
Research institutions and functional medicine practitioners have identified optimal ranges by studying populations with exceptional health, longevity, and minimal chronic disease. These ranges often fall within a narrower band than standard reference ranges, targeting values associated with peak physiological function.
| Biomarker Category | Normal Range Basis | Optimal Range Basis |
|---|---|---|
| Vitamin D | Statistical population average | Disease prevention and immune function studies |
| Thyroid Hormones | 95% population distribution | Symptom resolution and metabolic efficiency |
| Blood Glucose | Population sampling | Diabetes prevention and cardiovascular outcomes |
| Inflammatory Markers | Laboratory statistical analysis | Chronic disease risk reduction research |
The distinction between normal and optimal becomes particularly important for preventive health strategies. Lab test pricing transparency enables individuals to monitor biomarkers proactively rather than waiting for values to cross into abnormal territory.
Evidence-Based Versus Unsupported Optimal Ranges
Critical evaluation separates legitimate optimal ranges from marketing claims. Evidence-based optimal ranges derive from peer-reviewed research, clinical trials, and outcome studies published in medical literature. These ranges demonstrate clear associations between specific values and measurable health outcomes.
Characteristics of evidence-based optimal ranges:
- Published research supporting the recommended values
- Consistency across multiple independent studies
- Clear biological mechanisms explaining the associations
- Reproducible outcomes in clinical practice
- Consideration of individual variation and context
Conversely, some sources promote "optimal" ranges without adequate scientific support. These recommendations may stem from theoretical frameworks, anecdotal observations, or commercial interests rather than rigorous research. When encountering optimal range recommendations, verify the supporting evidence and consider the source's credibility.
Research on normal laboratory values provides important context for understanding how reference ranges are established and their inherent limitations in clinical practice.
Common Examples of Normal Versus Optimal Lab Ranges
Specific biomarkers illustrate the practical implications of normal versus optimal lab ranges in everyday health management. Vitamin D serves as a compelling example where normal and optimal values diverge significantly based on current research.
Vitamin D: A Case Study
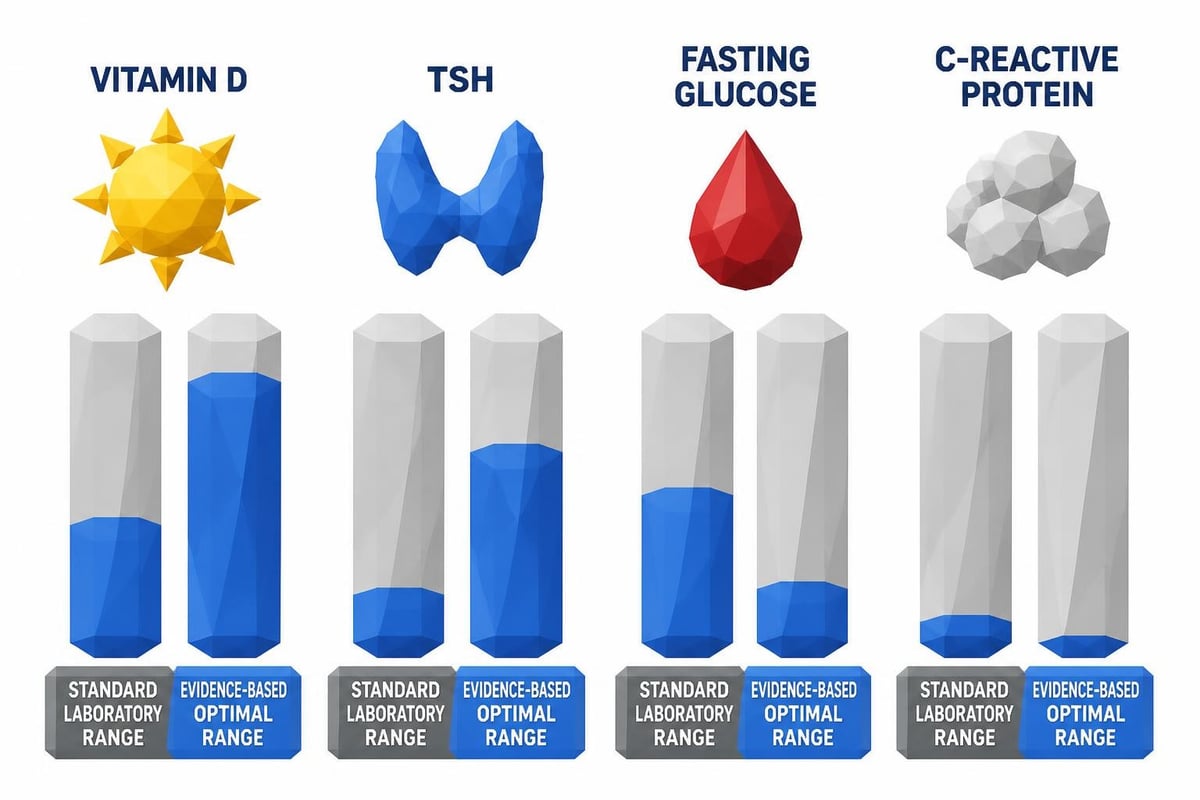
Most laboratories define normal vitamin D levels as 30-100 ng/mL, with levels below 30 ng/mL considered deficient. However, research on immune function, bone health, and chronic disease prevention suggests optimal levels fall between 40-60 ng/mL for most individuals.
A patient with vitamin D at 32 ng/mL receives results marked "normal" yet may experience suboptimal immune function, increased inflammation, or reduced bone mineral density. This person might benefit from supplementation despite technically normal values.
Recommended Test
Vitamin D, 25-Hydroxy
Vitamin D deficiency affects over 40% of Americans. This test measures your vitamin D status, essential for bone health, immune function, mood, and much more.
Includes 2 biomarkers
$25
Thyroid Function Markers
Thyroid-stimulating hormone (TSH) demonstrates another significant gap between normal and optimal values. Standard reference ranges typically span 0.4-4.0 mIU/L, but many individuals experience thyroid symptoms when TSH exceeds 2.5 mIU/L.
Thyroid markers requiring individualized interpretation:
- Free T3 and Free T4 levels
- Thyroid antibodies
- Reverse T3 ratios
- Clinical symptoms and metabolic rate
The differences between normal and optimal ranges become particularly important for thyroid health, where subtle variations can significantly impact energy, metabolism, and overall well-being.
Recommended Panel
Complete Thyroid Panel
Save $3Our most comprehensive thyroid panel includes all 5 essential markers: TSH, Free T4, Free T3, Reverse T3, and both thyroid antibodies. Get the complete picture of your thyroid health.
Includes 6 biomarkers
$84
Metabolic Markers
Fasting glucose provides another instructive example. Normal fasting glucose ranges from 70-99 mg/dL, with prediabetes diagnosed at 100-125 mg/dL. However, studies on diabetes prevention and metabolic health suggest optimal fasting glucose falls between 70-85 mg/dL.
Individuals with fasting glucose consistently above 90 mg/dL face increased diabetes risk over time, even though these values remain "normal" by standard criteria. Early intervention at this stage can prevent progression to prediabetes and diabetes.
| Biomarker | Standard Normal Range | Evidence-Based Optimal Range | Clinical Significance |
|---|---|---|---|
| Vitamin D (ng/mL) | 30-100 | 40-60 | Immune function, bone health |
| TSH (mIU/L) | 0.4-4.0 | 0.5-2.5 | Metabolic efficiency, symptom resolution |
| Fasting Glucose (mg/dL) | 70-99 | 70-85 | Diabetes prevention, metabolic health |
| hsCRP (mg/L) | <3.0 | <1.0 | Cardiovascular risk reduction |
Interpreting Lab Results in Clinical Context
Laboratory values never exist in isolation. Proper interpretation requires integrating test results with symptoms, medical history, family history, lifestyle factors, and other clinical information. This holistic approach distinguishes between results that require intervention and those that simply reflect individual variation.
A comprehensive evaluation considers multiple factors beyond the numbers themselves. Two individuals with identical lab values may require completely different responses based on their unique circumstances.
Symptoms and Quality of Life
Patient-reported symptoms provide crucial context for laboratory interpretation. Someone with thyroid markers in the low-normal range who experiences fatigue, weight gain, cold intolerance, and cognitive fog requires different consideration than an asymptomatic person with identical values.
The absence of symptoms doesn't necessarily indicate optimal health, but persistent symptoms despite "normal" labs warrant deeper investigation. This may include:
- Additional specialized testing
- Trends over time rather than single snapshots
- Evaluation of symptoms in relation to biomarker patterns
- Assessment of environmental and lifestyle factors
Ordering labs without a doctor enables individuals to proactively monitor biomarkers and track trends over time, providing valuable data for informed health decisions.
Medical and Family History
Personal and family medical history significantly influences how laboratory values should be interpreted. Someone with a strong family history of diabetes deserves closer scrutiny when glucose levels trend toward the upper normal range, even if not yet diagnostic.
Previous health conditions, medications, and historical lab trends all contribute to accurate interpretation. A sudden change in previously stable biomarkers may signal emerging health issues even when values remain within normal limits.
Lifestyle and Environmental Factors
Diet, exercise, sleep quality, stress levels, and environmental exposures profoundly affect laboratory values. Understanding these contexts prevents misinterpretation and guides appropriate interventions.
Lifestyle factors affecting lab interpretation:
- Recent dietary changes or fasting status
- Exercise intensity and timing relative to blood draw
- Medications and supplements
- Acute illness or chronic stress
- Sleep deprivation or shift work

The Role of Serial Testing and Trends
Single laboratory values provide limited information compared to trends over time. Serial testing reveals patterns, trajectories, and individual baselines that single snapshots cannot capture. An individual's optimal range may differ from population averages, making personal trends particularly valuable.
Someone whose vitamin D typically runs at 55 ng/mL who suddenly drops to 35 ng/mL has experienced a significant change despite remaining in the normal range. This decline warrants investigation and potential intervention, even though both values fall within reference limits.
Establishing Personal Baselines
Regular testing when healthy establishes individual baselines for comparison during illness or symptoms. These personal reference points often prove more valuable than population-based ranges for detecting meaningful changes.
Quarterly or annual testing of key biomarkers creates a health timeline that reveals subtle shifts before they become clinically significant. This proactive approach aligns with preventive medicine principles and enables early intervention.
Practical Application for Justlabs Customers
When receiving results from laboratory testing, approach interpretation systematically and thoughtfully. Start by reviewing whether values fall within the reference ranges provided, then consider whether those values represent optimal targets based on current evidence.
Documentation matters. Keep records of all laboratory results to track trends over time. Note the date, laboratory, specific tests performed, and any relevant symptoms or lifestyle factors at the time of testing. This information becomes invaluable for you and your healthcare providers.
Steps for effective result interpretation:
- Compare results to reference ranges provided
- Research evidence-based optimal ranges for key biomarkers
- Document trends and changes from previous tests
- Correlate results with current symptoms or health concerns
- Consult healthcare providers for personalized interpretation
- Consider retesting borderline or concerning values
The convenience of self-pay lab testing enables regular monitoring without insurance barriers or extended wait times, making proactive health management more accessible than ever.
When to Seek Medical Consultation
While understanding normal versus optimal lab ranges empowers informed health decisions, certain situations require professional medical consultation. Any significantly abnormal values, unexpected changes, or results that correlate with concerning symptoms deserve immediate attention from qualified healthcare providers.
Laboratory testing complements but does not replace comprehensive medical evaluation. Results should inform discussions with healthcare providers rather than serving as the sole basis for medical decisions.
Avoiding Common Interpretation Pitfalls
Several common mistakes undermine accurate laboratory interpretation. Recognizing these pitfalls helps avoid unnecessary anxiety or inappropriate interventions based on misunderstood results.
Common interpretation errors:
- Treating all "normal" results as optimal without further analysis
- Making drastic lifestyle changes based on single borderline values
- Comparing results across different laboratories without considering methodology differences
- Ignoring units of measurement and conversion factors
- Fixating on individual biomarkers while missing broader patterns
Different laboratories may use different testing methodologies, equipment, and reference ranges. When comparing results over time, note whether tests were performed at the same laboratory using the same methods.
The Limitations of Self-Diagnosis
Access to laboratory testing without physician orders represents a valuable tool for health monitoring, but this access carries responsibility. Understanding how lab testing works includes recognizing the difference between informed self-monitoring and attempting self-diagnosis of complex medical conditions.
Laboratory values provide data points that require interpretation within broader clinical context. Abnormal or concerning results should prompt professional consultation rather than self-prescribed treatments, particularly when dealing with potentially serious conditions.
The Future of Personalized Reference Ranges
The healthcare industry increasingly recognizes the limitations of one-size-fits-all reference ranges. Advances in data analytics, artificial intelligence, and personalized medicine point toward more individualized approaches to laboratory interpretation.
Emerging technologies enable analysis of large datasets to identify risk patterns and optimal ranges for specific populations, ages, or genetic profiles. This evolution promises more nuanced understanding of what constitutes healthy laboratory values for different individuals.
Research continues to refine our understanding of optimal versus normal ranges as longitudinal studies track health outcomes associated with specific biomarker values. These insights will likely reshape how laboratories establish and report reference ranges in coming years.
Integration of Multiple Data Streams
Future approaches may integrate laboratory values with wearable device data, genetic information, lifestyle tracking, and health outcomes to create truly personalized reference ranges. This comprehensive view could identify subtle imbalances before they manifest as disease.
The democratization of health data through services enabling direct laboratory access represents an important step toward patient empowerment and preventive healthcare. As individuals gain greater access to their health information, the distinction between normal and optimal lab ranges becomes increasingly relevant to everyday health decisions.
Making Informed Decisions About Testing Frequency
Appropriate testing frequency balances the benefits of monitoring against costs and practical considerations. Some biomarkers change slowly and require only annual monitoring, while others may need more frequent assessment during specific health interventions.
General health screening might include comprehensive metabolic panels, lipid profiles, and complete blood counts annually for healthy adults. Individuals managing specific conditions or making significant lifestyle changes may benefit from more frequent monitoring of relevant biomarkers.
| Health Status | Suggested Testing Frequency | Key Biomarkers to Monitor |
|---|---|---|
| Healthy adults | Annually | Comprehensive metabolic panel, lipids, vitamin D, thyroid |
| Active health optimization | Quarterly | Specific biomarkers related to interventions |
| Managing chronic conditions | As recommended by provider | Condition-specific markers |
| Post-intervention monitoring | 8-12 weeks after changes | Markers expected to respond to intervention |
Recommended Panel
Longevity & Aging Panel
Save $16.5This advanced panel targets the biomarkers that matter most for healthy aging: hormones that decline with age, metabolic health, inflammation, and cardiovascular risk factors.
Includes 46 biomarkers
$149
Fasting required
Transparent lab test pricing makes regular monitoring financially feasible for individuals committed to proactive health management, removing cost barriers that previously limited access to routine testing.
Understanding the distinction between normal and optimal lab ranges empowers you to take a more active role in your health journey while recognizing when professional medical guidance becomes essential. By viewing laboratory results as data points that require interpretation within the context of your symptoms, history, and individual circumstances, you can make more informed decisions about your wellbeing. Justlabs provides accessible, affordable laboratory testing that puts this valuable health information directly in your hands, with results available in 1-3 days and transparent pricing that makes regular monitoring practical for preventive health strategies.
Related Reading



References
Jones GRD, Haeckel R, Loh TP, Sikaris K, Streichert T, Katayev A, Barth JH, Ozarda Y, IFCC Committee on Reference Intervals and Decision Limits. Indirect methods for reference interval determination - review and recommendations. Clin Chem Lab Med. 2018 Dec 19;57(1):20-29. doi: 10.1515/cclm-2018-0073. PMID: 29672266. https://pubmed.ncbi.nlm.nih.gov/29672266/
Demay MB, Pittas AG, Bikle DD, Diab DL, Kiely ME, Lazaretti-Castro M, Lips P, Mitchell DM, Murad MH, Powers S, Rao SD, Scragg R, Tayek JA, Valent AM, Walsh JME, McCartney CR. Vitamin D for the Prevention of Disease: An Endocrine Society Clinical Practice Guideline. J Clin Endocrinol Metab. 2024 Jul 12;109(8):1907-1947. doi: 10.1210/clinem/dgae290. PMID: 38828931. https://pubmed.ncbi.nlm.nih.gov/38828931/
Biondi B, Cappola AR, Cooper DS. Subclinical Hypothyroidism: A Review. JAMA. 2019 Jul 9;322(2):153-160. doi: 10.1001/jama.2019.9052. PMID: 31287527. https://pubmed.ncbi.nlm.nih.gov/31287527/
Grundy SM. Pre-diabetes, metabolic syndrome, and cardiovascular risk. J Am Coll Cardiol. 2012 Feb 14;59(7):635-43. doi: 10.1016/j.jacc.2011.08.080. PMID: 22322078. https://pubmed.ncbi.nlm.nih.gov/22322078/
Ridker PM. A Test in Context: High-Sensitivity C-Reactive Protein. J Am Coll Cardiol. 2016 Feb 16;67(6):712-723. doi: 10.1016/j.jacc.2015.11.037. PMID: 26868696. https://pubmed.ncbi.nlm.nih.gov/26868696/