
Taking control of your health starts with understanding the data your body provides. While many people wait for a physician to explain their lab work, learning to read your lab results without a doctor empowers you to make informed decisions faster. This skill becomes especially valuable when using self-service testing platforms that deliver results directly to you within days. By developing basic literacy around common markers, reference ranges, and result interpretation, you can actively participate in your wellness journey rather than passively waiting for callbacks and appointments.
Understanding the Basic Structure of Lab Reports
Every laboratory report follows a standardized format designed to present information clearly. When you learn to read your lab results without a doctor, the first step involves recognizing these common sections.
Most reports begin with patient identification details and the ordering information. The main body contains the actual test results, typically organized into panels or individual tests depending on what you ordered. Each test line includes several critical components:
- Test name: The specific marker being measured (e.g., glucose, cholesterol, hemoglobin)
- Your result: The numerical value or qualitative finding from your sample
- Reference range: The normal values for that marker in the general population
- Units of measurement: How the result is quantified (mg/dL, mmol/L, cells/μL, etc.)
- Flag indicators: Symbols like "H" for high or "L" for low when outside normal range
The bottom of most reports includes methodology notes, laboratory certifications, and sometimes interpretive comments. Understanding this structure makes it easier to locate and interpret the information that matters most to your health concerns.

Decoding Reference Ranges and What They Mean
Reference ranges represent the values found in 95% of healthy individuals for any given marker. These ranges aren't arbitrary-they're established through extensive population studies. When your result falls within this range, it generally indicates normal function for that particular measure.
However, reference ranges can vary based on several factors. Age, sex, pregnancy status, and even time of day can influence what's considered normal. Laboratories may also use slightly different ranges depending on their equipment and methodology. According to MedlinePlus guidance on understanding lab results, context matters significantly when interpreting whether a result is truly concerning.
A value just outside the reference range doesn't automatically indicate disease. Similarly, a result within range doesn't guarantee optimal health. This is where learning to read your lab results without a doctor requires nuance and understanding that numbers tell a story beyond simple "pass" or "fail."
Common Blood Tests and How to Interpret Them
Self-service lab testing commonly includes several standard panels. Knowing what each measures helps you understand your health status comprehensively.
Complete Blood Count (CBC)
The CBC examines your blood cells and provides insights into overall health, immune function, and potential conditions. When you receive these results, you'll see multiple components:
| Component | What It Measures | Common Reference Range |
|---|---|---|
| White Blood Cells (WBC) | Immune system cells | 4,500-11,000 cells/μL |
| Red Blood Cells (RBC) | Oxygen-carrying cells | 4.5-5.9 million cells/μL (men), 4.1-5.1 (women) |
| Hemoglobin | Oxygen-carrying protein | 14-17 g/dL (men), 12-15 g/dL (women) |
| Hematocrit | Percentage of blood that's RBCs | 41-50% (men), 36-44% (women) |
| Platelets | Blood clotting cells | 150,000-400,000 cells/μL |
Elevated WBC might suggest infection or inflammation. Low RBC, hemoglobin, or hematocrit could indicate anemia. High platelet counts may relate to inflammation, while low counts could affect clotting ability. These interpretations help when you learn to order labs without a doctor and need to understand what you're seeing.
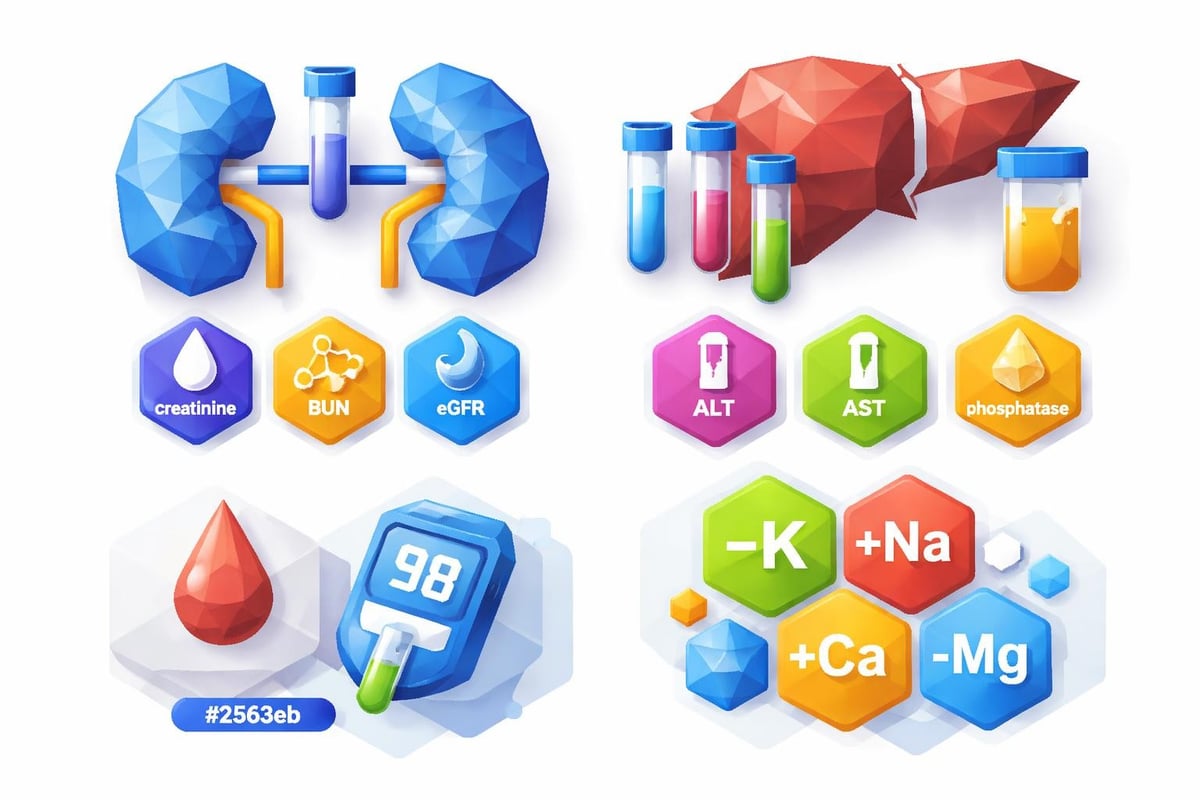
Comprehensive Metabolic Panel (CMP)
The comprehensive metabolic panel test evaluates kidney function, liver function, electrolyte balance, and blood sugar. This 14-component panel provides crucial metabolic information.
Kidney Function Markers:
- Creatinine (0.7-1.3 mg/dL): Waste product filtered by kidneys
- Blood Urea Nitrogen or BUN (7-20 mg/dL): Another waste product
- eGFR (>60 mL/min): Estimated kidney filtration rate
Liver Function Markers:
- ALT and AST (7-56 U/L): Enzymes indicating liver cell health
- Alkaline Phosphatase (44-147 U/L): Enzyme related to bile ducts and bones
- Total Bilirubin (0.1-1.2 mg/dL): Byproduct of red blood cell breakdown
Blood Sugar and Electrolytes:
- Glucose (70-100 mg/dL fasting): Blood sugar level
- Sodium, Potassium, Chloride, Carbon Dioxide: Essential electrolytes maintaining fluid balance
When kidney markers are elevated, it may indicate reduced kidney function. Liver enzymes outside normal ranges could suggest liver stress or damage. Blood sugar levels help assess diabetes risk or management. Understanding these markers is fundamental to reading your lab results without a doctor effectively.
Recommended Test
Comprehensive Metabolic Panel
The CMP is a widely used screening test that provides important information about your metabolism, including blood sugar, electrolyte balance, kidney function, and liver health.
Includes 16 biomarkers
$9.5
Fasting required
Lipid Panel for Heart Health
Cholesterol testing reveals cardiovascular risk factors. The standard lipid panel includes four key measurements:
- Total Cholesterol: Should be below 200 mg/dL for optimal health
- LDL Cholesterol: "Bad" cholesterol; optimal is below 100 mg/dL
- HDL Cholesterol: "Good" cholesterol; higher is better (above 40 mg/dL for men, 50 mg/dL for women)
- Triglycerides: Fat in blood; normal is below 150 mg/dL
The ratio between total cholesterol and HDL matters as much as individual numbers. A ratio below 5:1 is desirable, with optimal being 3.5:1 or lower. High LDL combined with low HDL creates greater cardiovascular risk than either factor alone.
Recommended Test
Lipid Panel (Standard)
The standard lipid panel measures your cholesterol and triglyceride levels - essential markers for assessing your risk of heart disease and stroke.
Includes 5 biomarkers
$8
Fasting required
Thyroid Function Tests
Thyroid panels typically measure TSH (thyroid-stimulating hormone) and sometimes T3 and T4 hormones. TSH is the primary screening tool:
- Normal range: 0.4-4.0 mIU/L (some labs use 0.5-5.0)
- High TSH suggests hypothyroidism (underactive thyroid)
- Low TSH indicates hyperthyroidism (overactive thyroid)
When TSH is abnormal, additional tests measuring actual thyroid hormones (Free T4, Free T3) help clarify the diagnosis. According to WebMD's lab results guide, thyroid testing requires careful interpretation because symptoms often overlap with other conditions.
Recommended Panel
Basic Thyroid Panel
Save $2This panel includes the 3 essential thyroid markers: TSH, Free T4, and Free T3. The perfect starting point for evaluating thyroid function without unnecessary tests.
Includes 3 biomarkers
$30
Interpreting Flags and Abnormal Results
Red flags on lab reports grab attention immediately. But learning to read your lab results without a doctor means understanding what these alerts actually signify.
High and Low Indicators
Most laboratories mark out-of-range values with "H" for high or "L" for low. Some add additional symbols:
- Critical values: Often marked with asterisks or highlighted, requiring immediate attention
- Borderline results: May show as slightly outside range but not critically concerning
- Trends: Comparing current results to previous tests reveals patterns
A single abnormal result rarely provides a complete picture. Patterns matter more. For instance, glucose slightly above 100 mg/dL once might be meaningless, but consistently elevated readings suggest prediabetes or diabetes requiring intervention.
When One Abnormal Value Matters vs. Multiple Markers
Isolated abnormalities often have benign explanations. Perhaps you weren't truly fasting, felt stressed during the blood draw, or recently exercised. Multiple related markers trending abnormal carries more significance.
For example, elevated creatinine alone might reflect dehydration. But high creatinine combined with low eGFR and elevated BUN strongly suggests kidney function issues. Similarly, high AST could result from strenuous exercise, but when ALT and bilirubin are also elevated, liver problems become more likely.
Cigna's overview on understanding lab results emphasizes considering the complete clinical picture rather than fixating on individual numbers.
Special Considerations for Common Health Markers
Some tests require specific interpretation strategies beyond simple reference range comparison.
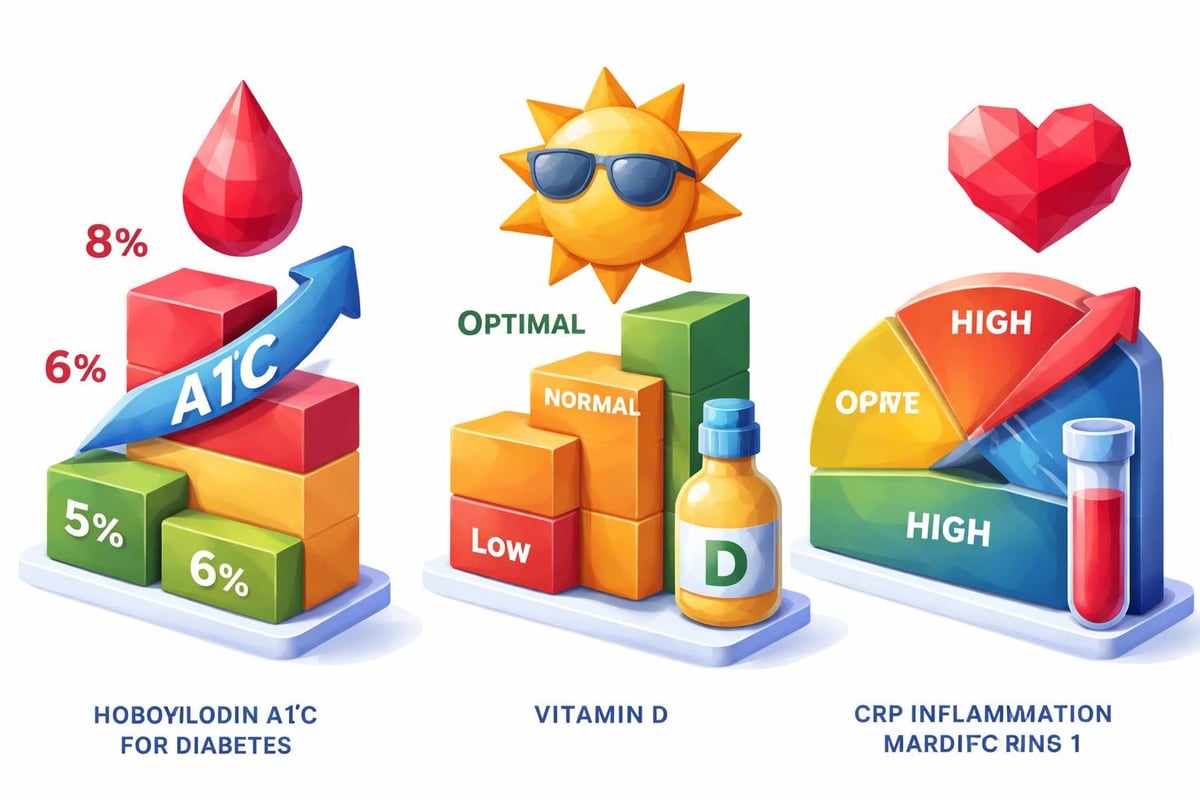
Hemoglobin A1C for Diabetes Management
The A1C test measures average blood sugar over the past 2-3 months. Unlike daily glucose testing, it provides a longer-term picture:
- Below 5.7%: Normal
- 5.7-6.4%: Prediabetes
- 6.5% or higher: Diabetes
For people managing diabetes, target A1C depends on individual factors. Generally, below 7% indicates good control, though some aim for 6.5% or lower. This test exemplifies how to read your lab results without a doctor while still understanding disease management goals.
Vitamin D Levels
Vitamin D deficiency is widespread, making this a frequently ordered test. The results are measured in ng/mL:
- Deficient: Below 20 ng/mL
- Insufficient: 20-30 ng/mL
- Sufficient: 30-50 ng/mL
- Optimal: Many experts suggest 40-60 ng/mL
- High: Above 100 ng/mL may cause toxicity
Supplementation needs vary based on your starting level, sun exposure, skin tone, and absorption capability. Results in the "insufficient" range might benefit from moderate supplementation.
Inflammation Markers
C-Reactive Protein (CRP) and Erythrocyte Sedimentation Rate (ESR) measure inflammation:
CRP levels:
- Low risk: Below 1.0 mg/L
- Average risk: 1.0-3.0 mg/L
- High risk: Above 3.0 mg/L
High-sensitivity CRP (hs-CRP) is used specifically for cardiovascular risk assessment. Regular CRP is used for detecting general inflammation or infection. Values above 10 mg/L typically indicate acute inflammation or infection rather than chronic low-grade inflammation.
Factors That Affect Lab Results
Accurate interpretation requires understanding what influences your numbers beyond underlying health conditions.
Timing and Preparation
Many tests require specific preparation. Fasting tests (typically 8-12 hours without food) include glucose, lipid panels, and comprehensive metabolic panels. Eating before these tests can artificially elevate results, particularly glucose and triglycerides.
Time of day matters for certain hormones. Cortisol peaks in the morning and declines throughout the day. Testosterone is highest in the morning for most people. Taking these tests at different times produces different results even when health status remains constant.
Hydration status significantly impacts several markers. Dehydration concentrates blood, potentially elevating creatinine, BUN, and hematocrit. Overhydration can dilute these values, creating falsely reassuring results.
Medications and Supplements
Numerous substances affect lab values. Biotin supplements can interfere with thyroid tests, creating falsely abnormal TSH and hormone levels. The solution is stopping biotin at least 48 hours before testing.
Common medications with lab impacts include:
- Statins: May elevate liver enzymes
- Diuretics: Affect electrolyte balance and kidney markers
- Corticosteroids: Increase blood sugar and WBC count
- NSAIDs: Can impact kidney function tests
When ordering tests through platforms that allow you to access lab testing without insurance, disclosure of medications helps you interpret results accurately even without a physician intermediary.
Lifestyle Factors
Exercise, stress, alcohol consumption, and diet all influence lab values. Intense exercise within 24 hours of testing can elevate creatinine and liver enzymes. Alcohol consumption affects liver enzymes and triglycerides. High-protein diets may increase BUN levels.
Stress during blood draws can temporarily raise glucose and WBC counts. This is why consistent testing conditions matter when tracking trends over time.
Using Online Resources to Enhance Understanding
Multiple reputable sources help you read your lab results without a doctor more effectively. RSC Health's interpretation guide breaks down common terms and explains different test types in accessible language.
Forward Family Medicine's plain-English guide covers CBC and metabolic panels thoroughly, making complex medical terminology understandable for patients taking an active role in their health.
When researching specific tests, look for resources from medical institutions, certified laboratories, and health organizations rather than unverified websites. The quality of information matters when making health decisions.
What to Do With Your Results
Understanding numbers is only the first step. Action based on those numbers completes the empowerment cycle.
Tracking Trends Over Time
Single test results provide snapshots. Trends reveal trajectories. Creating a simple spreadsheet or using health tracking apps helps visualize changes in key markers over months or years.
For example, watching fasting glucose creep from 95 to 102 to 108 mg/dL over three tests signals a concerning trend toward prediabetes, even though all three values fall within or near normal range. Early intervention becomes possible when you notice these patterns yourself.
When to Seek Medical Consultation
Learning to read your lab results without a doctor doesn't mean never consulting healthcare professionals. Certain situations warrant expert guidance:
- Critical abnormalities: Values marked as critical require immediate medical attention
- Multiple abnormal markers: Complex patterns need professional interpretation
- Persistent abnormalities: Values that don't normalize with lifestyle changes
- Symptoms accompanying abnormal labs: Physical symptoms combined with concerning numbers
- Treatment decisions: While you can understand your results, medication decisions require medical expertise
The goal is informed participation in your healthcare, not replacing medical judgment entirely. Platforms like Justlabs make it easy to access affordable lab testing when you want to monitor specific markers, then consult physicians when results warrant professional input.
Implementing Lifestyle Changes
Many abnormal lab values respond to lifestyle modifications. Elevated glucose and A1C often improve with dietary changes, weight loss, and increased physical activity. High cholesterol may decrease with dietary fat modification and exercise. Vitamin deficiencies resolve with supplementation.
Track your interventions alongside your lab work. If you start taking Vitamin D supplements for a level of 22 ng/mL, retest in 8-12 weeks to verify improvement. This creates a feedback loop where you see direct results from your health efforts.
Limitations of Self-Interpretation
Honest assessment of what you can and cannot determine from lab results is essential. You can read your lab results without a doctor and understand what most numbers mean, but several limitations exist.
Context matters tremendously. Labs don't exist in isolation-symptoms, medical history, family history, physical exam findings, and other factors contribute to accurate diagnosis. A complete blood count showing slightly low hemoglobin might indicate simple iron deficiency in one person but signal underlying bleeding in another.
Some patterns require expertise to recognize. Subtle combinations of markers that suggest rare conditions or early disease states often escape non-expert notice. Physicians spend years learning to recognize these patterns.
Reference ranges aren't personalized. Your optimal values might differ from population averages. Some people feel best with thyroid markers at specific points within the reference range, not just anywhere within it.
These limitations don't invalidate self-education. They simply define its boundaries. Understanding your results, asking informed questions, and knowing when to seek help represents the ideal approach.
Maximizing Value From Direct-Access Lab Testing
The rise of self-pay testing services revolutionizes healthcare access. Instead of waiting for doctor appointments to order routine monitoring tests, you can proactively check important health markers on your schedule.
This model works especially well for:
- Routine health monitoring: Annual lipid panels, metabolic panels, or A1C tests
- Tracking chronic conditions: Regular monitoring between doctor visits
- Preventive screening: Checking markers before symptoms appear
- Supplement or diet verification: Testing whether interventions work
- Second opinions on concerning symptoms: Getting objective data before appointments
When you understand how self-service lab testing works, you gain flexibility in health management. Results typically arrive within 1-3 days, giving you quick feedback on health status without the delays of traditional healthcare scheduling.
The transparent pricing model of direct-access testing also eliminates surprise bills. You know exactly what you'll pay before ordering, whether using FSA/HSA accounts for eligible tests or paying out of pocket.
Building Your Lab Literacy Skillset
Like any skill, the ability to read your lab results without a doctor improves with practice and continued learning. Start with the basics-understanding the tests you order most frequently. Gradually expand your knowledge to encompass more specialized markers.
Keep a health journal documenting your results, noting what you were doing lifestyle-wise when each test was taken. Over time, you'll notice personal patterns. Maybe your triglycerides rise during holiday seasons when sugar intake increases. Perhaps your Vitamin D drops in winter months despite supplementation.
This personalized understanding surpasses generic reference ranges. You become an expert on your own body's patterns and responses.
Additionally, review the comprehensive test menu periodically to familiarize yourself with available options. Understanding what can be measured helps you make informed decisions about which tests provide value for your specific health goals and concerns.
Taking charge of your health data empowers you to make informed decisions quickly and confidently. While professional medical guidance remains valuable for complex situations, basic lab literacy allows you to understand your body's signals and respond proactively. Whether you're monitoring chronic conditions, optimizing wellness, or investigating symptoms, direct access to testing combined with interpretation skills creates a powerful health management approach. Justlabs makes this possible by providing fast, affordable, transparent lab testing that delivers results directly to you within 1-3 days, giving you the information you need to take action on your health journey.