Understanding the distinction between insulin resistance and diabetes is crucial for early detection and prevention of metabolic disease. Many people confuse these two conditions, but they represent different stages in a metabolic continuum. More importantly, the lab panels designed to detect each condition measure different biomarkers and serve distinct clinical purposes. Knowing whether to test for early insulin resistance or monitor established blood sugar problems can make the difference between preventing diabetes and managing its complications.
What Insulin Resistance and Diabetes Actually Measure
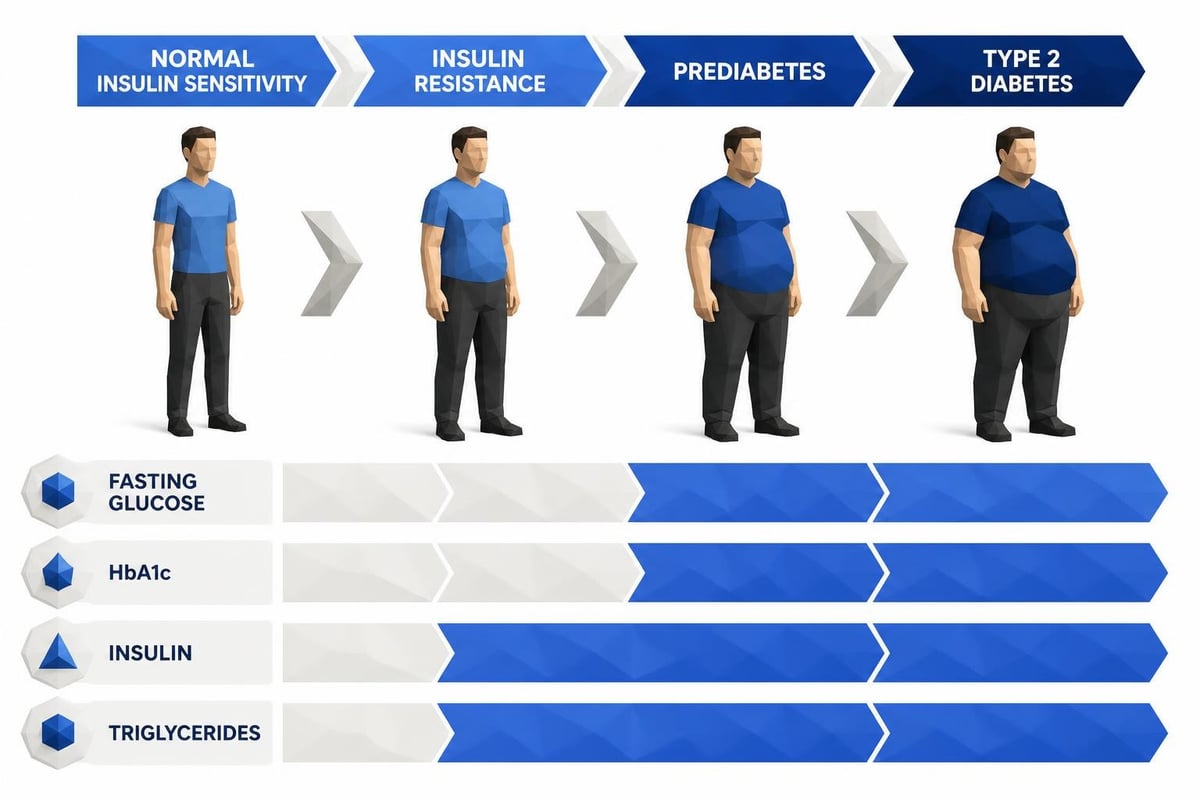
Insulin resistance occurs when your cells become less responsive to insulin signals, forcing your pancreas to produce increasingly higher amounts of insulin to maintain normal blood glucose levels. This compensatory mechanism can work for years before blood sugar rises to diabetic levels. Diabetes, by contrast, represents the failure of this compensation-when your pancreas can no longer produce enough insulin to overcome cellular resistance or maintain glucose control.
The key difference lies in timing and severity. Insulin resistance often precedes diabetes by many years, making it a critical window for intervention. During the insulin resistance phase, your fasting glucose may appear completely normal on standard tests, while elevated insulin levels work behind the scenes to maintain that normalcy.
Why Standard Diabetes Tests Miss Early Problems
Traditional diabetes screening focuses on glucose measurements-fasting glucose and hemoglobin A1c. These tests only become abnormal after significant metabolic dysfunction has occurred. By the time your fasting glucose exceeds 100 mg/dL or your A1c reaches 5.7%, you've already experienced years of progressive insulin resistance.
Standard diabetes tests detect:
- Elevated blood glucose levels
- Long-term glucose exposure through A1c
- Impaired glucose tolerance
- Beta cell failure or significant dysfunction
These markers answer the question "Do you have diabetes or prediabetes?" but fail to identify the earlier insulin resistance phase when intervention is most effective.
Breaking Down the Insulin Resistance Panel
An insulin resistance panel specifically targets the early detection phase by measuring how hard your body works to maintain normal blood sugar. The cornerstone of this panel is fasting insulin measurement, a test rarely included in routine diabetes screening but essential for identifying metabolic dysfunction before glucose rises.
Core Components of Insulin Resistance Testing
The most comprehensive approach to testing for insulin resistance includes several key measurements that reveal different aspects of metabolic health:
| Test | Purpose | Optimal Range |
|---|---|---|
| Fasting Insulin | Direct measure of insulin production | <5 µIU/mL |
| Fasting Glucose | Current blood sugar level | 70-85 mg/dL |
| HOMA-IR | Calculated insulin resistance index | <1.0 |
| Triglycerides | Metabolic dysfunction marker | <100 mg/dL |
| HDL Cholesterol | Protective cholesterol fraction | >60 mg/dL |
| Triglyceride/HDL Ratio | Insulin resistance indicator | <2.0 |
Fasting insulin serves as the most sensitive early warning system. While conventional reference ranges often extend to 25 µIU/mL or higher, functional medicine practitioners recognize that levels above 5 µIU/mL suggest developing insulin resistance, even when glucose remains normal.
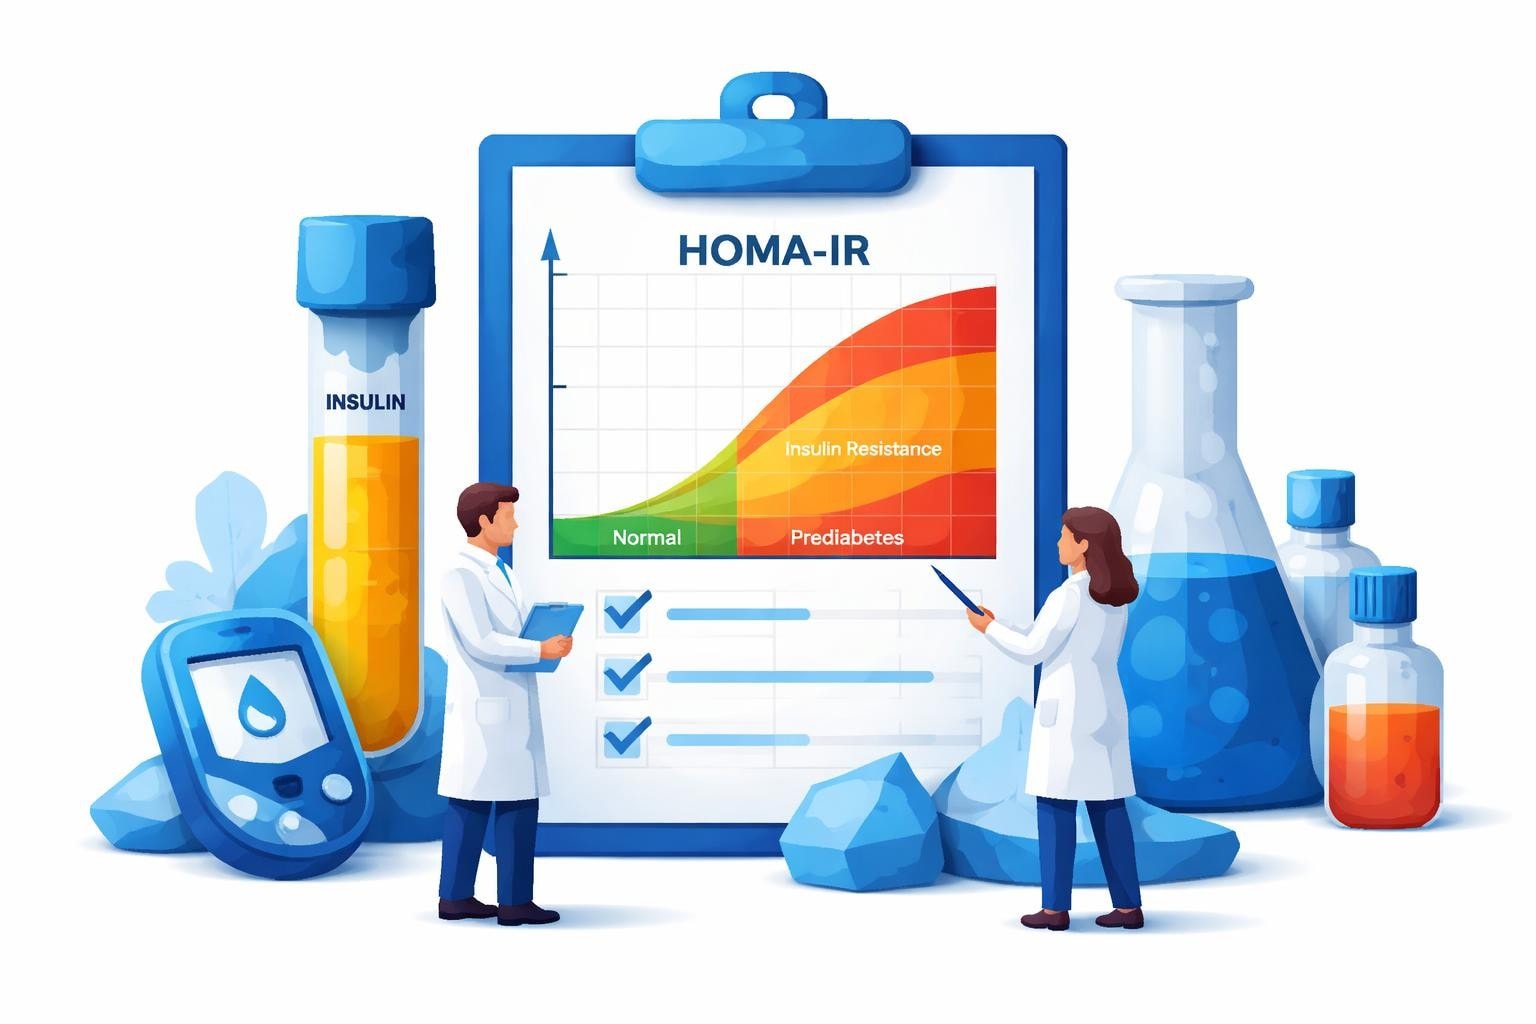
The HOMA-IR calculation combines fasting glucose and insulin to estimate insulin resistance severity. The formula provides a single number that reflects how efficiently your cells respond to insulin signals. Values below 1.0 indicate excellent insulin sensitivity, while readings above 2.0 confirm significant resistance.
Why Lipid Patterns Matter for Insulin Resistance
The triglyceride-to-HDL ratio provides a surprisingly accurate surrogate marker for insulin resistance. Research consistently shows that individuals with ratios above 3.0 demonstrate significant insulin resistance, even when other markers appear normal. This ratio costs nothing extra to calculate if you're already testing lipids and offers valuable confirmatory evidence.
When ordering lab tests without a doctor, platforms like Justlabs make it simple to access these specialized panels that primary care providers might not routinely order.
Recommended Panel
Complete Metabolic Health Panel
Save $3.5This comprehensive panel evaluates all aspects of metabolic health: organ function, cholesterol, blood sugar, insulin resistance, and inflammation - the key drivers of chronic disease.
Includes 26 biomarkers
$50
Fasting required
Understanding the Comprehensive Diabetes Panel
While insulin resistance panels target early detection, comprehensive diabetes panels focus on monitoring established blood sugar abnormalities and assessing diabetes-related complications. These panels assume metabolic dysfunction already exists and aim to quantify its severity and impact.
What Diabetes Panels Include
A thorough diabetes monitoring panel extends beyond simple glucose measurement to evaluate glycemic control, organ function, and complication risk:
Blood sugar markers:
- Fasting glucose
- Hemoglobin A1c (3-month average)
- Postprandial glucose (sometimes)
Kidney function tests:
- Creatinine
- eGFR (estimated glomerular filtration rate)
- Microalbumin/creatinine ratio
Lipid assessment:
- Total cholesterol
- LDL cholesterol
- HDL cholesterol
- Triglycerides
Additional monitoring:
- Liver function tests
- Electrolytes
- Complete blood count
These panels answer fundamentally different questions than insulin resistance testing. Rather than asking "Am I developing metabolic dysfunction?", they address "How well controlled is my diabetes?" and "Are complications developing?"
Recommended Panel
Comprehensive Diabetes Panel
This panel detects diabetes and prediabetes at every stage. Includes lipids because diabetes dramatically increases heart disease risk.
Includes 10 biomarkers
$35
Fasting required
Insulin Resistance Versus Diabetes Panels: The Critical Distinctions
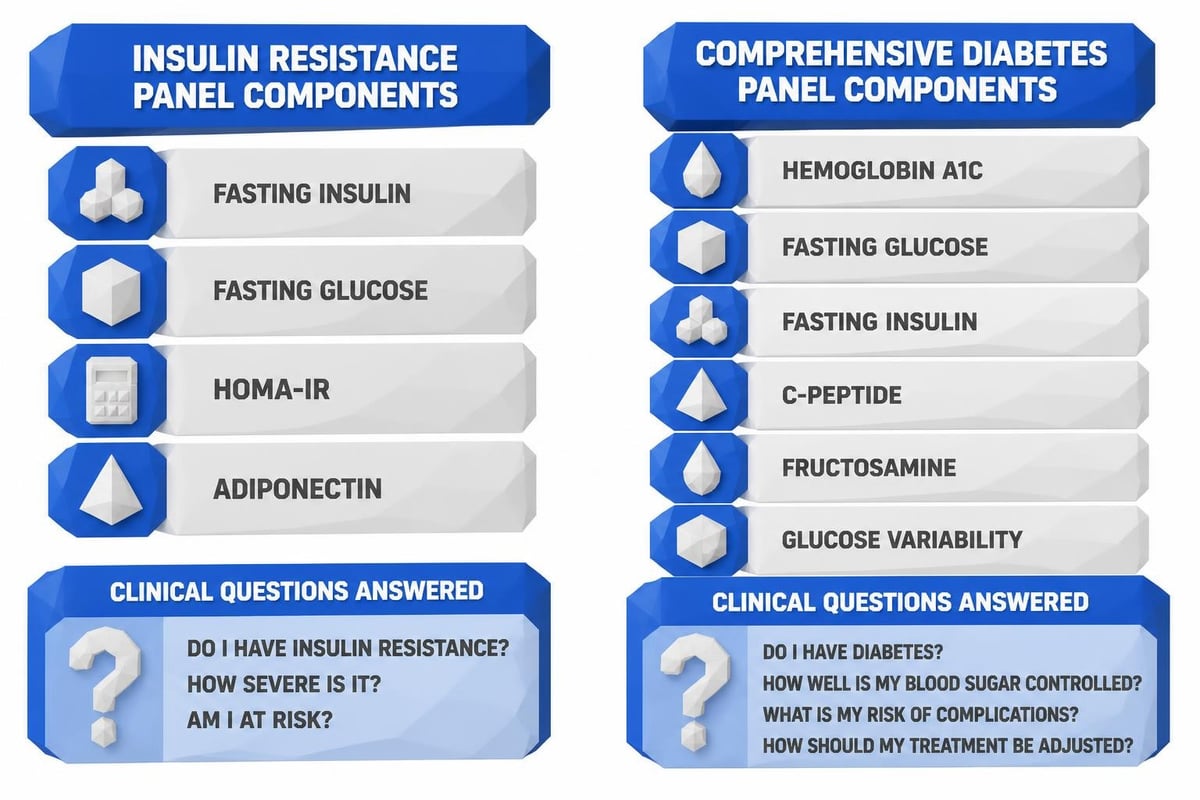
The fundamental difference between insulin resistance versus diabetes panels lies in their clinical purpose and the stage of metabolic disease they target. Understanding these distinctions helps you select the appropriate testing strategy for your situation.
Detection Versus Monitoring
Insulin resistance panels excel at early detection before conventional markers become abnormal. They identify metabolic dysfunction when intervention can still reverse the process. By measuring fasting insulin and calculating HOMA-IR, these panels detect problems 5-10 years before diabetes diagnosis.
Diabetes panels focus on monitoring and complication prevention in people with established prediabetes or diabetes. They track how well blood sugar is controlled over time and screen for kidney damage, cardiovascular risk, and other diabetes-related complications.
Intervention Windows and Testing Strategy
| Stage | Appropriate Panel | Primary Goal | Intervention Focus |
|---|---|---|---|
| Metabolically healthy | Insulin resistance | Prevention screening | Lifestyle optimization |
| Early insulin resistance | Insulin resistance | Reverse dysfunction | Diet, exercise, weight loss |
| Prediabetes | Both panels | Prevent progression | Intensive lifestyle changes |
| Type 2 diabetes | Diabetes panel | Manage disease | Medication, monitoring |
Choosing between panels isn't always binary. Many individuals benefit from baseline insulin resistance testing followed by periodic diabetes panel monitoring if metabolic markers worsen. The differences between insulin resistance and diabetes become clearer when you understand what each panel reveals.
When to Order Each Type of Panel
Selecting the right panel requires honest assessment of your metabolic health status and risk factors. Several scenarios clearly favor one panel over the other, though some situations warrant both.
Ideal Candidates for Insulin Resistance Panels
You should prioritize insulin resistance testing if you have:
- Family history of diabetes but normal glucose levels
- Unexplained weight gain, especially around the midsection
- Difficulty losing weight despite diet and exercise
- PCOS or other hormonal imbalances
- Signs of metabolic syndrome (high blood pressure, elevated triglycerides)
- Skin tags or acanthosis nigricans (darkened skin patches)
- Energy crashes after meals
- Normal fasting glucose but concerning symptoms
People under 40 with metabolic risk factors particularly benefit from early insulin resistance screening. Research on insulin resistance shows that catching dysfunction at this stage offers the greatest opportunity for complete reversal through lifestyle modification.
When Diabetes Panels Make More Sense
Comprehensive diabetes panels become appropriate when:
- You've been diagnosed with prediabetes or diabetes
- Your fasting glucose consistently exceeds 100 mg/dL
- Your A1c measures 5.7% or higher
- You're taking diabetes medication
- You need to monitor diabetes complications
- You require quarterly or annual diabetes management tests
Cost considerations also matter. Diabetes panels typically cost more than insulin resistance panels due to their comprehensive nature. When using transparent lab test pricing, you can compare panel costs and select testing that matches both your clinical needs and budget.

Interpreting Results: What Your Numbers Mean
Understanding how to read your lab results empowers you to take appropriate action. The same number can have different implications depending on which panel you're reviewing and your overall metabolic context.
Insulin Resistance Panel Interpretation
When reviewing insulin resistance panel results, focus on patterns rather than isolated values:
Optimal insulin resistance profile:
- Fasting insulin: 2-5 µIU/mL
- Fasting glucose: 70-85 mg/dL
- HOMA-IR: 0.5-1.0
- Triglycerides: 50-100 mg/dL
- HDL cholesterol: >60 mg/dL
- TG/HDL ratio: <1.0
Early insulin resistance warning signs:
- Fasting insulin: 6-10 µIU/mL
- Fasting glucose: 86-99 mg/dL
- HOMA-IR: 1.0-2.0
- Triglycerides: 101-150 mg/dL
- HDL cholesterol: 40-60 mg/dL
- TG/HDL ratio: 2.0-3.0
These ranges differ from conventional laboratory reference ranges, which often normalize pathology. Testing for insulin resistance requires using functional rather than standard reference ranges to identify problems early.
Diabetes Panel Result Patterns
Diabetes monitoring panels generate more data points, requiring systematic review:
Glycemic control markers tell you about recent and long-term blood sugar management. A1c reflects 3-month average glucose, while fasting glucose shows current control. Discordance between these values suggests variability in blood sugar control or recent changes in management.
Kidney function deteriorates silently in diabetes. Rising creatinine, falling eGFR, or detectable microalbumin signal early kidney damage requiring immediate intervention.
Lipid abnormalities in diabetes typically show elevated triglycerides, low HDL, and small dense LDL particles-a pattern that dramatically increases cardiovascular risk even when total cholesterol appears acceptable.
The Role of Additional Biomarkers
Both insulin resistance and diabetes panels can incorporate additional markers that provide deeper metabolic insights. These optional tests refine risk assessment and guide personalized interventions.
Advanced Insulin Resistance Markers
C-peptide measurement reflects your pancreas's actual insulin production capacity. Unlike insulin levels, which can be affected by exogenous insulin in diabetics, C-peptide reveals endogenous production. Low C-peptide suggests beta cell exhaustion, while high levels confirm hyperinsulinemia.
Adiponectin, a hormone produced by fat tissue, inversely correlates with insulin resistance. Lower adiponectin levels predict worse insulin sensitivity, while higher levels indicate better metabolic health. Though not routinely included in standard panels, adiponectin adds valuable information for borderline cases.
Comprehensive Metabolic Assessment
Some providers now offer expanded panels combining elements of both approaches:
- Fasting insulin and glucose
- Hemoglobin A1c
- Complete lipid panel with particle size
- High-sensitivity C-reactive protein
- Liver enzymes (ALT, AST, GGT)
- Vitamin D
- Thyroid function
This comprehensive approach captures both early dysfunction and established disease, making it ideal for individuals with mixed presentations or unclear metabolic status.
Cost and Access Considerations
The financial aspect of insulin resistance versus diabetes panels significantly influences testing decisions, especially for self-pay patients. Understanding what drives costs helps you make informed choices.
Price Differences Between Panels
Insulin resistance panels typically range from $50-150, depending on components included. The basic version with fasting insulin, glucose, and lipids costs less, while comprehensive versions adding C-peptide or adiponectin increase pricing.
Diabetes panels cost $100-300 for comprehensive versions including kidney function, liver enzymes, and complete metabolic panels. The broader scope and greater number of tests drive higher costs.
Bundled savings matter. Testing platforms offering transparent pricing often bundle related tests at discounts compared to ordering individually. A comprehensive insulin resistance panel costs less than ordering fasting insulin, glucose, lipids, and calculated ratios separately.
Insurance Versus Self-Pay Dynamics
Insurance coverage for preventive insulin resistance testing varies widely. Many plans won't cover fasting insulin without established diabetes diagnosis, creating a catch-22 where you can't get tested until you're already sick.
Self-pay testing through direct access labs eliminates these barriers. You decide which tests to order based on your health concerns rather than insurance protocols. Most people find that affordable self-pay panels cost less than insurance copays and deductibles anyway.
When comparing providers, platforms like those comparing lab testing services show price and convenience differences clearly.
Frequency and Follow-Up Testing
How often you should repeat insulin resistance versus diabetes panels depends on your baseline results, risk factors, and intervention response. Strategic timing maximizes value while controlling costs.
Monitoring Insulin Resistance
If initial insulin resistance testing shows optimal results with low risk factors, retest every 2-3 years as baseline screening. This frequency catches gradual metabolic decline before it becomes problematic.
When early insulin resistance appears (HOMA-IR 1.0-2.0, fasting insulin 6-10 µIU/mL), retest every 6-12 months while implementing lifestyle interventions. This frequency allows you to track whether your efforts are reversing dysfunction or whether it's progressing despite intervention.
Response tracking requires consistency. Always test in the same fasted state (12-14 hours), at similar times of day, and through the same laboratory to minimize variability.
Diabetes Panel Frequency
Established diabetes requires more frequent monitoring:
- Newly diagnosed: Every 3 months initially
- Well-controlled stable diabetes: Every 6 months
- Poor control or medication changes: Every 3 months
- Complication screening (kidney, eyes): Annually minimum
The American Diabetes Association recommends A1c testing at least twice yearly for stable patients and quarterly for those with poor control or recent treatment changes.
Taking Action Based on Your Results
Laboratory data only creates value when it drives meaningful action. Both insulin resistance and diabetes panels should trigger specific interventions based on findings.
Responding to Insulin Resistance Findings
Early-stage insulin resistance (HOMA-IR 1.0-2.0) responds remarkably well to lifestyle interventions:
Dietary modifications:
- Reduce refined carbohydrates and added sugars
- Increase fiber intake to 30-40 grams daily
- Emphasize protein and healthy fats
- Consider time-restricted eating
Exercise prescription:
- Resistance training 3x weekly
- High-intensity intervals 2x weekly
- Daily movement and walking
- Reduce sedentary time
Sleep and stress management:
- Prioritize 7-9 hours quality sleep
- Implement stress reduction practices
- Address sleep disorders if present
Many people completely reverse early insulin resistance within 3-6 months using these strategies, confirmed by follow-up testing showing normalized fasting insulin and HOMA-IR.
Managing Diabetes Panel Abnormalities
Elevated A1c or fasting glucose requires more intensive intervention, often combining lifestyle changes with medication. Your approach should match severity:
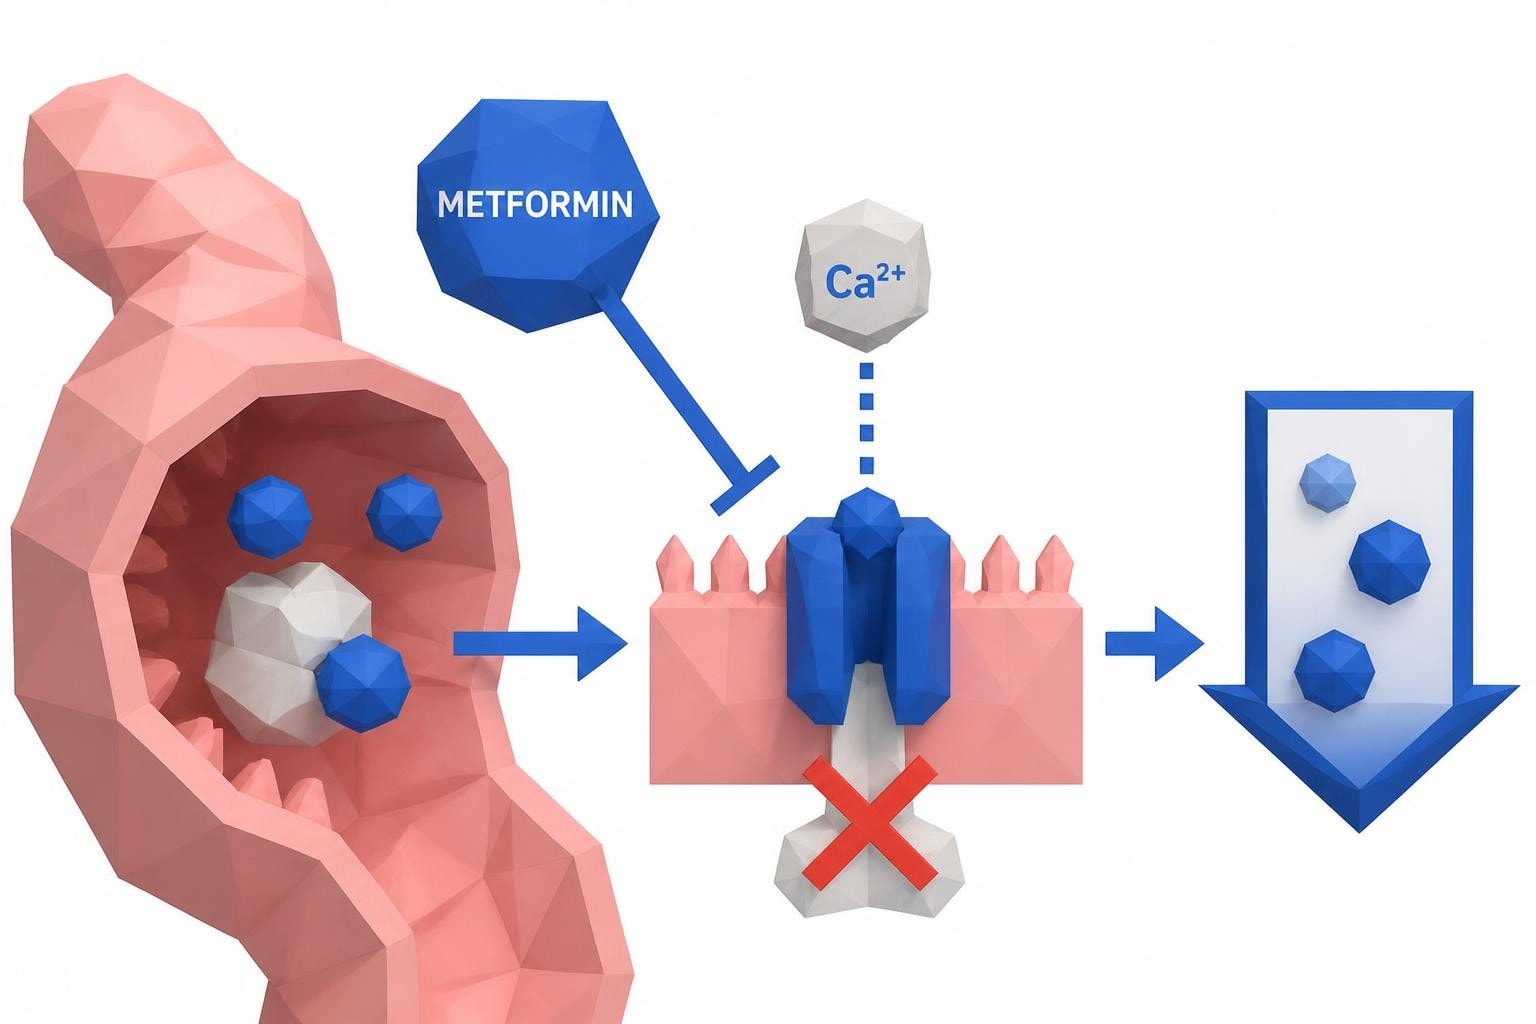
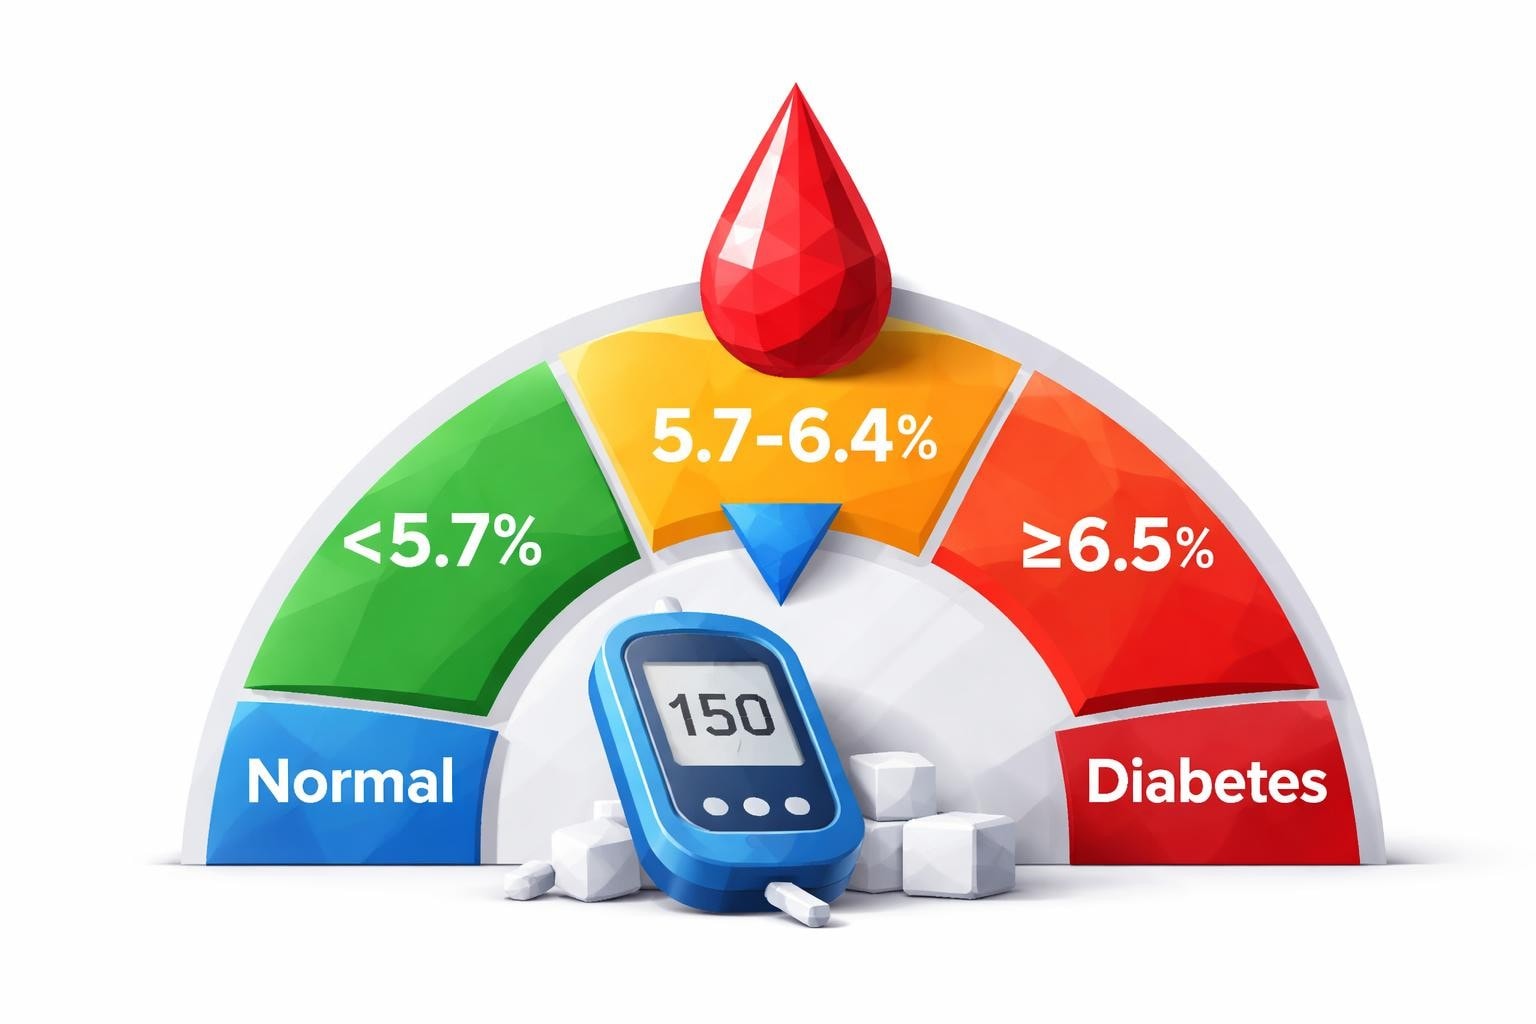
- A1c 5.7-6.4% (prediabetes): Aggressive lifestyle intervention, possibly metformin
- A1c 6.5-7.0% (diabetes): Lifestyle plus medication, frequent monitoring
- A1c >7.0%: Medication intensification, specialist consultation
Kidney function abnormalities (elevated creatinine, low eGFR, microalbuminuria) warrant immediate consultation with a nephrologist. Early diabetic kidney disease can often be slowed or halted, but delayed intervention leads to irreversible damage.
Combining Panels for Comprehensive Assessment
Some clinical scenarios benefit from ordering both insulin resistance and diabetes panels simultaneously or sequentially. This combined approach provides the most complete metabolic picture.
When Both Panels Add Value
Consider comprehensive testing combining both panel types if:
- You have prediabetes (A1c 5.7-6.4%) and want to assess insulin resistance severity
- Your fasting glucose is borderline but you have strong risk factors
- You're implementing aggressive lifestyle interventions and want complete baseline data
- You have diabetes but never had insulin resistance testing when first diagnosed
- You're evaluating metabolic syndrome or PCOS
The combined data reveals whether diabetes resulted from insulin resistance (high insulin, Type 2 pattern) or other mechanisms. This distinction influences optimal treatment selection.
Sequential Testing Strategies
Starting with insulin resistance screening makes sense for most preventive-minded individuals under 50 without diabetes diagnosis. If results show concerning trends, add diabetes panel components for broader assessment.
Conversely, individuals already diagnosed with prediabetes or diabetes should establish baseline diabetes panel results, then add insulin resistance markers like fasting insulin and HOMA-IR to understand underlying mechanisms driving their condition.
Recommended Test
Insulin, Fasting
Fasting insulin measures how much insulin your pancreas produces to control blood sugar - an early warning sign of metabolic problems.
Includes 1 biomarkers
$14
Fasting required
Understanding the distinction between insulin resistance versus diabetes panels empowers you to choose testing that matches your metabolic health stage and prevention goals. Early insulin resistance detection offers the best opportunity for complete reversal, while comprehensive diabetes monitoring prevents complications in those with established disease. Whether you need preventive screening or ongoing diabetes management, Justlabs provides convenient access to both panel types with transparent pricing and results in 1-3 days, helping you take control of your metabolic health without insurance hassles or doctor visit delays.
Related Reading
References
Samuel VT, Shulman GI. The pathogenesis of insulin resistance: integrating signaling pathways and substrate flux. J Clin Invest. 2016 Jan;126(1):12-22. doi: 10.1172/JCI77812. PMID: 26727229. https://pubmed.ncbi.nlm.nih.gov/26727229/
Khan RMM, Chua ZJY, Tan JC, Yang Y, Liao Z, Zhao Y. From Pre-Diabetes to Diabetes: Diagnosis, Treatments and Translational Research. Medicina (Kaunas). 2019 Aug 29;55(9). doi: 10.3390/medicina55090546. PMID: 31470636. https://pubmed.ncbi.nlm.nih.gov/31470636/
Tahapary DL, Pratisthita LB, Fitri NA, Marcella C, Wafa S, Kurniawan F, Rizka A, Tarigan TJE, Harbuwono DS, Purnamasari D, Soewondo P. Challenges in the diagnosis of insulin resistance: Focusing on the role of HOMA-IR and Tryglyceride/glucose index. Diabetes Metab Syndr. 2022 Aug;16(8):102581. doi: 10.1016/j.dsx.2022.102581. PMID: 35939943. https://pubmed.ncbi.nlm.nih.gov/35939943/
Baneu P, Văcărescu C, Drăgan SR, Cirin L, Lazăr-Höcher AI, Cozgarea A, Faur-Grigori AA, Crișan S, Gaiță D, Luca CT, Cozma D. The Triglyceride/HDL Ratio as a Surrogate Biomarker for Insulin Resistance. Biomedicines. 2024 Jul 5;12(7). doi: 10.3390/biomedicines12071493. PMID: 39062066. https://pubmed.ncbi.nlm.nih.gov/39062066/
Jayedi A, Soltani S, Emadi A, Najafi A, Zargar MS. Efficacy of lifestyle weight loss interventions on regression to normoglycemia and progression to type 2 diabetes in individuals with prediabetes: a systematic review and pairwise and dose-response meta-analyses. Am J Clin Nutr. 2024 Nov;120(5):1043-1052. doi: 10.1016/j.ajcnut.2024.08.031. PMID: 39222689. https://pubmed.ncbi.nlm.nih.gov/39222689/
Colhoun HM, Marcovecchio ML. Biomarkers of diabetic kidney disease. Diabetologia. 2018 May;61(5):996-1011. doi: 10.1007/s00125-018-4567-5. PMID: 29520581. https://pubmed.ncbi.nlm.nih.gov/29520581/