Your body's ability to respond to insulin determines whether you maintain healthy blood sugar levels or progress toward metabolic disease. Most people discover they have a problem only after years of silent metabolic dysfunction, when a routine glucose test reveals prediabetes or type 2 diabetes. By that point, significant damage may already be occurring. The good news is that advanced diagnostic methods using routine blood biomarkers can identify problems much earlier, giving you the opportunity to intervene before serious complications develop.
Understanding How Insulin Resistance Develops
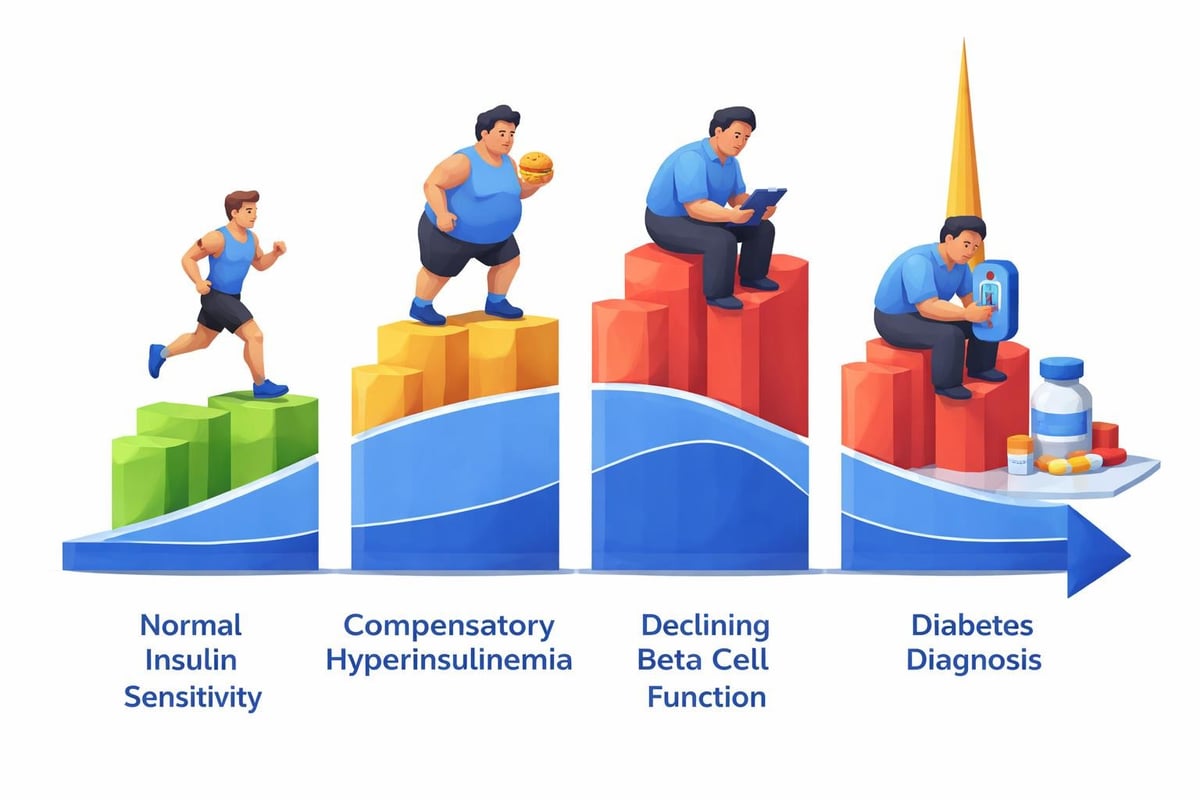
Insulin acts as a key that unlocks your cells, allowing glucose from your bloodstream to enter and provide energy. When cells become less responsive to insulin's signal, your pancreas compensates by producing more of this hormone. For months or even years, this compensation keeps your blood sugar within normal ranges while insulin levels climb higher and higher.
This condition represents one of the most common metabolic disorders in the United States, affecting an estimated 40% of adults. The pathophysiology of insulin resistance involves complex interactions between genetic predisposition, lifestyle factors, and chronic inflammation. Yet standard medical care typically doesn't screen for it until glucose levels have already risen.
The Problem with Standard Testing Approaches
Traditional diabetes screening relies primarily on fasting glucose and hemoglobin A1C measurements. Both of these markers reflect blood sugar control, but they don't tell you anything about insulin function until the problem has become severe enough to affect glucose regulation.
Consider this timeline:
- Year 0-5: Cells become less insulin-sensitive, pancreas increases insulin production, glucose remains normal
- Year 5-8: Insulin levels climb significantly higher, glucose starts to creep upward but often stays under diagnostic thresholds
- Year 8-10: Pancreas can no longer keep up with demand, glucose rises into prediabetic range
- Year 10+: Full type 2 diabetes develops
Standard screening catches the problem at step 3 or 4. Earlier testing catches it at step 1 or 2, when intervention is most effective.
Why Fasting Insulin Matters More Than You Think
Measuring insulin directly provides a window into metabolic health that glucose testing simply cannot offer. When your fasting insulin levels are elevated, it signals that your body is already working overtime to maintain normal blood sugar, even though those efforts are still succeeding.
Normal fasting insulin ranges typically fall between 2-20 μIU/mL, but optimal levels are actually much lower. Values above 10 μIU/mL suggest early metabolic dysfunction, while levels above 15 μIU/mL indicate significant concern. Many people with "normal" glucose have fasting insulin levels of 20, 30, or even 40 μIU/mL, revealing a problem that won't show up on standard testing for years.
What Your Fasting Insulin Level Reveals
The number on your fasting insulin test tells a specific story about your metabolic state:
- Below 5 μIU/mL: Excellent insulin sensitivity, low metabolic risk
- 5-10 μIU/mL: Good sensitivity, generally healthy metabolism
- 10-15 μIU/mL: Mild resistance developing, lifestyle changes recommended
- 15-20 μIU/mL: Moderate resistance, intervention needed
- Above 20 μIU/mL: Significant resistance, high risk for progression
Research shows that hyperinsulinemia plays a central role in the development and progression of type 2 diabetes, making it a critical early warning sign. Testing your insulin level provides actionable information years before other markers become abnormal.
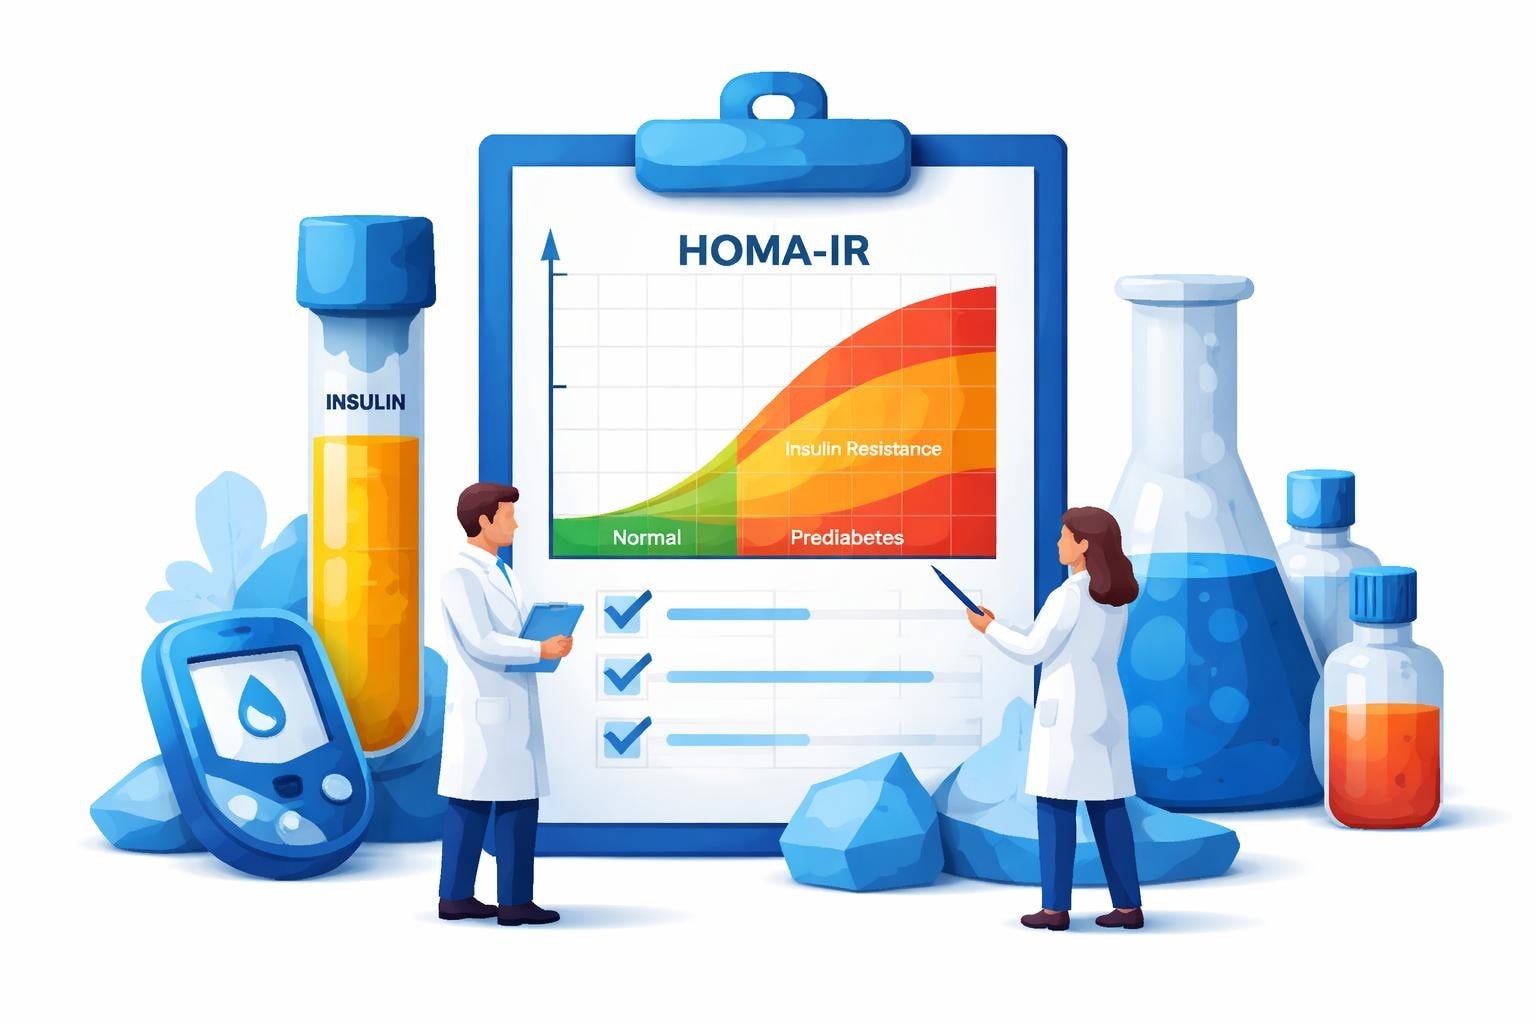
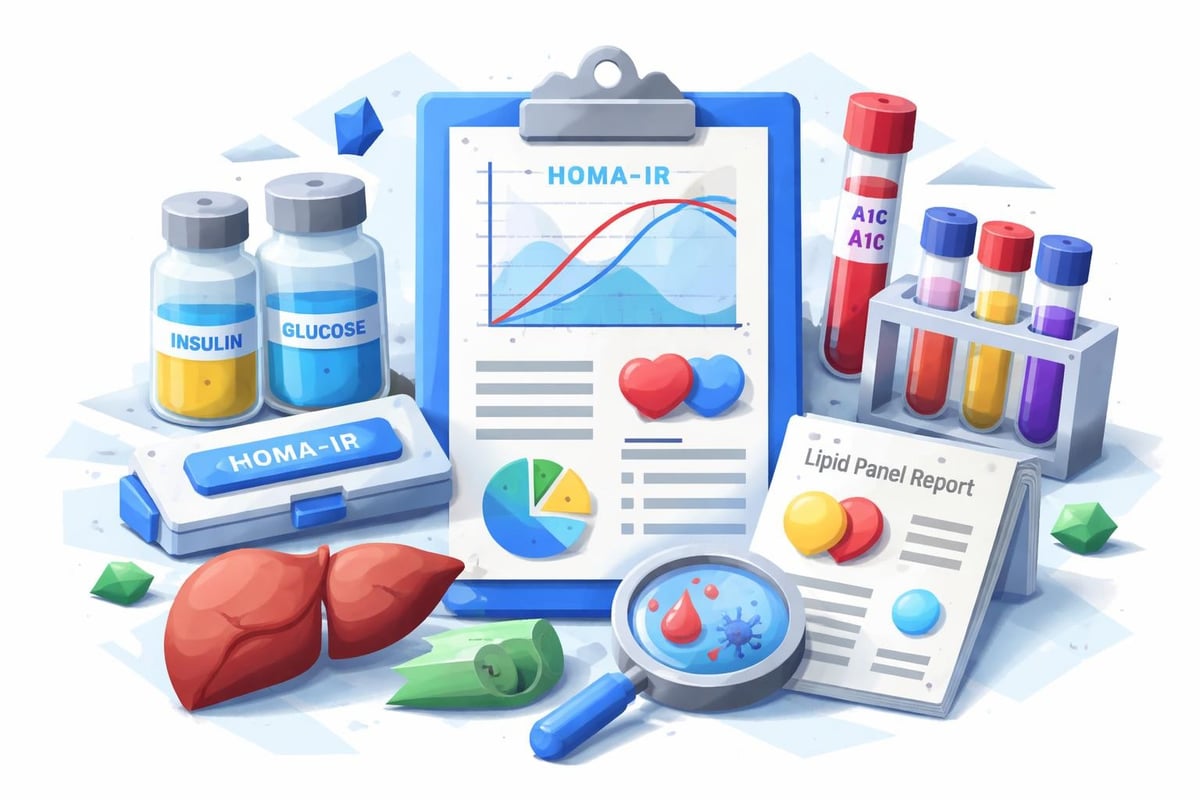
The HOMA-IR Calculation: Your Insulin Sensitivity Score
The Homeostatic Model Assessment of Insulin Resistance (HOMA-IR) combines fasting glucose and fasting insulin measurements into a single score that quantifies how well your body responds to insulin. This calculation was developed specifically to estimate insulin sensitivity without requiring complex clinical tests.
The formula is straightforward: HOMA-IR = (fasting insulin × fasting glucose) / 405 when using conventional U.S. units. A lower score indicates better insulin sensitivity, while higher scores reveal increasing resistance.
| HOMA-IR Score | Interpretation | Risk Level |
|---|---|---|
| Below 1.0 | Excellent insulin sensitivity | Low |
| 1.0-1.9 | Normal sensitivity | Low |
| 2.0-2.9 | Early insulin resistance | Moderate |
| 3.0-4.9 | Significant resistance | High |
| 5.0+ | Severe resistance | Very High |
Why HOMA-IR Outperforms Single Markers
Looking at glucose or insulin alone provides incomplete information. HOMA-IR captures the relationship between these two values, revealing how hard your pancreas must work to maintain a given glucose level. Two people might have identical fasting glucose of 95 mg/dL, but one achieves this with insulin of 5 μIU/mL (HOMA-IR of 1.2) while the other requires insulin of 18 μIU/mL (HOMA-IR of 4.2). The second person has significant metabolic dysfunction despite "normal" glucose.
This integrated assessment makes HOMA-IR particularly valuable for tracking changes over time. As you implement dietary changes, exercise programs, or other interventions, you can watch your score improve, confirming that your efforts are working at the metabolic level.
The Complete Early Detection Panel
While fasting insulin and HOMA-IR form the foundation of early detection, a comprehensive assessment includes additional markers that reveal different aspects of metabolic health. Together, these tests create a complete picture of your risk profile.
Essential Tests for Comprehensive Screening
Fasting glucose establishes your baseline blood sugar control and is required for HOMA-IR calculation. Even if this value appears normal, it provides critical context when interpreted alongside insulin levels.
Hemoglobin A1C reflects your average blood sugar over the previous three months, catching patterns that single time-point measurements might miss. Values between 5.7% and 6.4% indicate prediabetes, but optimal levels are actually below 5.3%.
Lipid panel reveals metabolic changes that often accompany developing resistance. High triglycerides (above 150 mg/dL) combined with low HDL cholesterol (below 40 mg/dL for men, below 50 mg/dL for women) create a pattern strongly associated with metabolic dysfunction.
C-reactive protein (CRP) measures systemic inflammation, which both contributes to and results from insulin-related metabolic problems. Elevated CRP often precedes other abnormalities by years.
Advanced Markers Worth Considering
For those wanting even deeper insights, several additional tests can prove valuable:
- Uric acid: Elevated levels predict future metabolic disease and may play a causal role
- Liver enzymes (ALT, AST): Mild elevations often reflect fatty liver disease, closely linked to resistance
- Vitamin D: Deficiency correlates strongly with metabolic dysfunction
- Thyroid panel: Thyroid problems can mimic or worsen metabolic issues
The wide array of tests available through modern lab services makes it easy to get comprehensive screening without requiring multiple doctor visits or insurance approvals.
Who Should Get Tested and When
Waiting for symptoms to appear means waiting too long. The condition develops silently, and by the time you experience obvious signs like frequent urination, excessive thirst, or unexplained fatigue, significant metabolic damage has already occurred.
High-Priority Screening Groups
Several populations face elevated risk and should pursue early testing regardless of symptoms:
Anyone with a family history of type 2 diabetes, prediabetes, or metabolic syndrome should get baseline testing by age 25 and retest every 2-3 years minimum.
People carrying excess weight, particularly abdominal fat, face dramatically higher risk. Testing becomes critical when waist circumference exceeds 40 inches for men or 35 inches for women.
Those with PCOS (polycystic ovary syndrome) have extremely high rates of metabolic dysfunction, with some studies suggesting prevalence above 70%. Early testing and intervention can prevent progression and may improve fertility outcomes.
Individuals with a history of gestational diabetes carry lifelong elevated risk and should maintain regular screening even if postpartum glucose testing returned to normal.
Testing Frequency Recommendations
How often you retest depends on your initial results and risk profile:
- Normal results with low risk: Every 3-5 years
- Borderline results: Every 12-18 months
- Abnormal results with intervention: Every 3-6 months to track progress
- High risk factors present: Annual screening minimum
The affordable and transparent pricing of self-pay lab services makes regular monitoring accessible without the barrier of insurance requirements or doctor referrals.
Interpreting Your Results: Beyond the Reference Range
Laboratory reports typically include reference ranges representing values found in the general population. However, these ranges often include many people with subclinical disease, meaning "normal" on your lab report doesn't necessarily mean "optimal" for health.
The Gap Between Normal and Optimal
Standard lab reference ranges for fasting insulin might extend to 25 or even 30 μIU/mL, but research consistently shows that values above 10 μIU/mL predict future metabolic disease. Similarly, fasting glucose up to 99 mg/dL is considered "normal," but studies indicate that values above 90 mg/dL correlate with increased risk.
This creates a dangerous gray zone where people receive reassuring test results despite developing metabolic problems. Understanding optimal ranges helps you recognize early warning signs:
| Test | Standard Range | Optimal Range | Action Threshold |
|---|---|---|---|
| Fasting Insulin | 2-25 μIU/mL | 2-7 μIU/mL | Above 10 |
| Fasting Glucose | 70-99 mg/dL | 70-85 mg/dL | Above 90 |
| HOMA-IR | Not typically reported | Below 1.5 | Above 2.0 |
| Triglycerides | Below 150 mg/dL | Below 100 mg/dL | Above 100 |
| HDL Cholesterol | Above 40 mg/dL | Above 60 mg/dL | Below 50 |
Patterns That Reveal Hidden Problems
Sometimes the most important information comes from looking at combinations of results rather than individual values. Certain patterns reliably indicate metabolic dysfunction even when no single test appears drastically abnormal.
The dyslipidemic triad (high triglycerides, low HDL, small dense LDL particles) strongly suggests underlying resistance. A triglyceride-to-HDL ratio above 2.0 serves as a simple screening tool that often correlates with abnormal HOMA-IR.
Normal glucose with high insulin represents classic early-stage disease. Your pancreas is successfully preventing glucose elevation, but only through excessive insulin production that cannot be sustained indefinitely.
Elevated liver enzymes with high triglycerides typically indicates non-alcoholic fatty liver disease, which shares common metabolic roots with insulin-related dysfunction and often develops in parallel.
What to Do When Results Show Early Resistance
Discovering metabolic dysfunction in its early stages provides a tremendous advantage. At this point, lifestyle interventions alone can often reverse the problem completely, preventing progression to more serious disease.
Dietary Strategies That Work
Reducing refined carbohydrates and added sugars forms the foundation of dietary intervention. These foods spike both glucose and insulin, perpetuating the metabolic dysfunction. Prioritizing whole foods, adequate protein, and healthy fats helps stabilize blood sugar and reduce insulin demand.
Time-restricted eating shows promise in improving insulin sensitivity even without calorie restriction. Limiting food intake to an 8-10 hour window allows insulin levels to drop during the fasting period, giving cells a chance to restore sensitivity.
Prioritizing fiber from vegetables, legumes, and whole grains slows glucose absorption and improves metabolic outcomes. Aim for at least 30 grams daily from whole food sources.
Exercise as Metabolic Medicine
Physical activity improves insulin sensitivity through multiple mechanisms, making it one of the most powerful interventions available.
Resistance training builds muscle tissue, which serves as a major glucose disposal site. More muscle means more capacity to clear glucose from the bloodstream without excessive insulin. Two to three sessions per week produce measurable benefits.
High-intensity interval training appears particularly effective at improving metabolic markers. Short bursts of intense effort followed by recovery periods enhance insulin sensitivity more than steady-state cardio of similar duration.
Daily movement matters as much as structured exercise. Breaking up prolonged sitting with short movement breaks significantly improves glucose and insulin responses to meals.

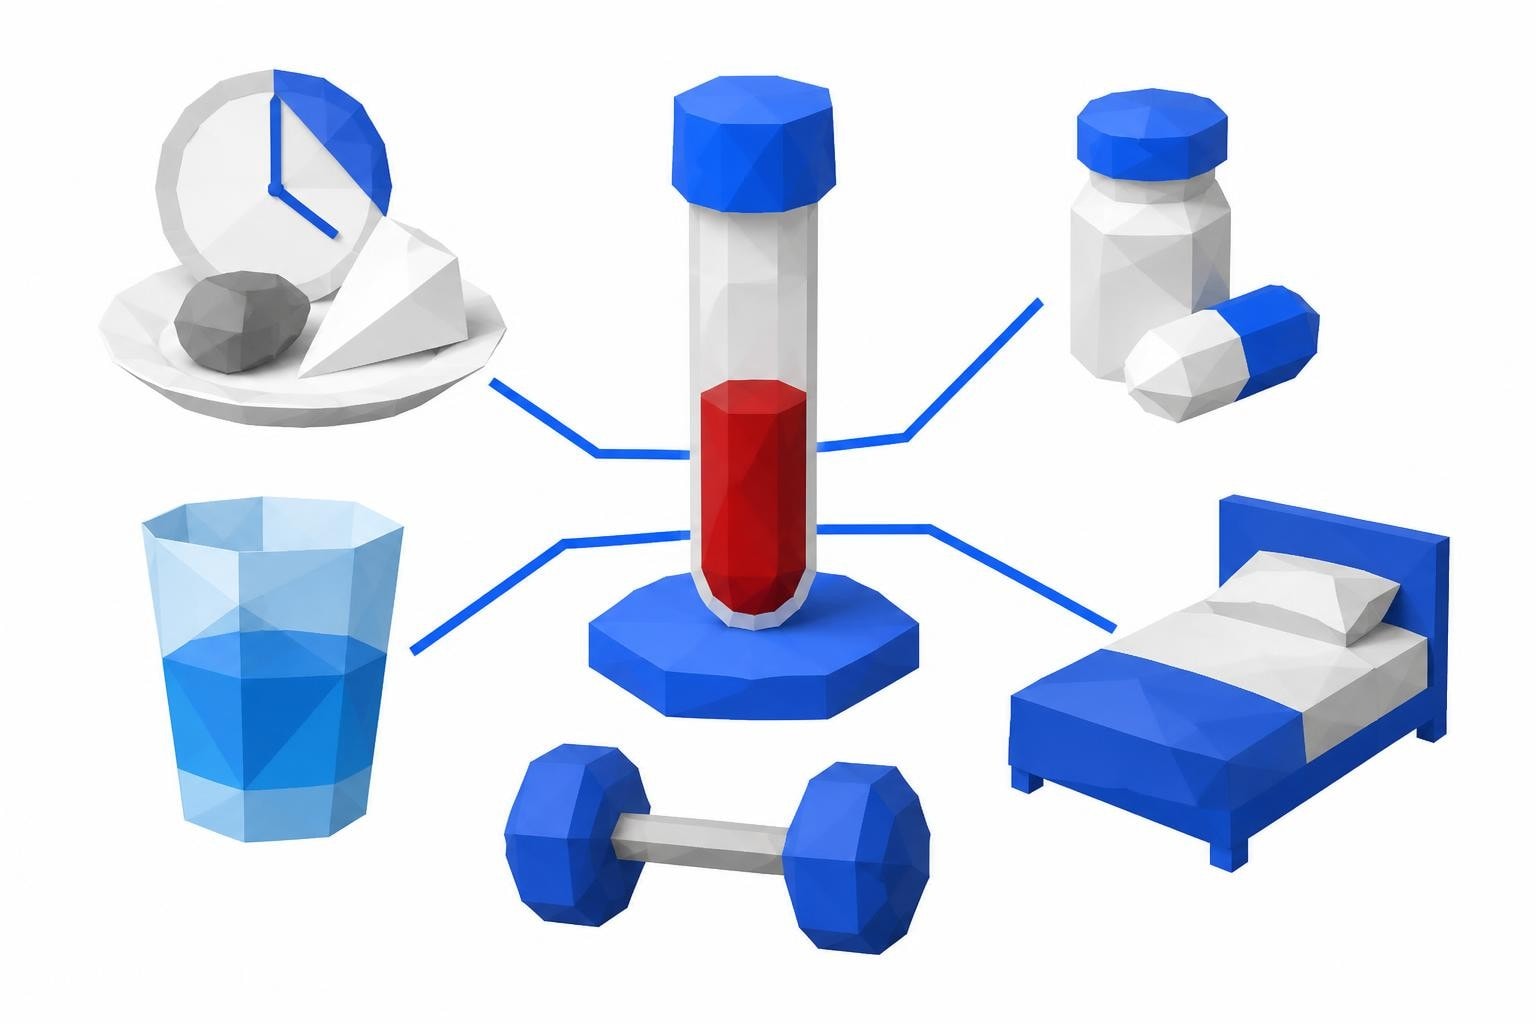
Additional Interventions to Consider
Sleep quality profoundly affects metabolic health. Even a single night of poor sleep temporarily worsens insulin sensitivity, while chronic sleep deprivation drives progressive metabolic dysfunction. Prioritize 7-9 hours of quality sleep nightly.
Stress management deserves serious attention, as chronic stress elevates cortisol, which directly impairs insulin sensitivity. Regular meditation, yoga, or other stress-reduction practices show measurable benefits on metabolic markers.
Certain supplements show promise in research, though they should complement rather than replace lifestyle changes. Magnesium, vitamin D, berberine, and cinnamon have evidence supporting metabolic benefits, but quality and dosing matter significantly.
The Economics of Early Detection
Preventing diabetes delivers enormous financial benefits compared to managing the disease once established. The American Diabetes Association estimates that diagnosed diabetes costs an average of $16,752 per person annually, with two-thirds of that attributed directly to the condition. Over a lifetime, the difference between prevention and treatment amounts to hundreds of thousands of dollars.
Traditional Testing Barriers
Insurance-based testing for metabolic markers often requires meeting specific criteria, such as BMI over 25 with additional risk factors or age over 45. This leaves many at-risk individuals without access to early screening. Even when testing is covered, copays, deductibles, and required doctor visits add costs and complexity.
Many physicians order only fasting glucose or A1C, missing the opportunity to catch problems earlier with insulin and HOMA-IR testing. Patients who want more comprehensive screening often face resistance or confusion about why additional tests would be necessary when glucose appears normal.
The Self-Pay Advantage
Direct-access lab testing eliminates these barriers by allowing individuals to order their own tests at transparent prices. The straightforward process typically involves selecting tests online, visiting a local lab for blood draw, and receiving results within days.
For early detection panels including fasting insulin, glucose, A1C, and lipids, self-pay pricing often comes in well below insurance deductibles, particularly for those with high-deductible health plans. No referral, no appointment wait times, and no insurance paperwork required.
This approach empowers individuals to take charge of their metabolic health through regular monitoring without navigating the healthcare system's gatekeeping mechanisms.
Tracking Progress Over Time
Once you've established your baseline and implemented interventions, follow-up testing confirms whether your efforts are working. Watching your numbers improve provides powerful motivation to maintain healthy habits.
Realistic Timelines for Improvement
Metabolic changes don't happen overnight, but neither do they take years. Most people see measurable improvements within weeks to months of consistent lifestyle changes.
Fasting insulin often improves within 4-8 weeks of dietary changes, particularly when reducing refined carbohydrates and implementing time-restricted eating. Drops of 30-50% are not uncommon with aggressive intervention.
HOMA-IR follows a similar timeline, as it depends primarily on insulin and glucose levels. A score dropping from 3.5 to 2.0 over three months would represent excellent progress.
Hemoglobin A1C changes more slowly, reflecting a three-month average. Expect to wait at least 90 days to see the full impact of interventions on this marker.
Lipid panels typically show improvement within 6-12 weeks, with triglycerides often dropping quickly and HDL rising more gradually.
Building Your Testing Schedule
Create a testing calendar based on your initial results and intervention plan:
- Baseline testing: Complete panel including insulin, glucose, A1C, lipids, and inflammatory markers
- 3-month follow-up: Repeat insulin, glucose, and HOMA-IR to assess early progress
- 6-month follow-up: Complete panel to evaluate comprehensive changes including A1C
- Annual monitoring: Once optimal values achieved, maintain yearly screening to catch any backsliding
Document your results in a spreadsheet or health app, tracking trends over time. This creates a clear picture of your metabolic trajectory and helps identify which interventions produce the best results for your individual physiology.
Special Considerations for Different Populations
While the basic principles of early detection apply universally, certain groups face unique challenges or require modified approaches.
Women's Health Considerations
Hormonal fluctuations throughout the menstrual cycle can affect insulin sensitivity, with resistance typically increasing during the luteal phase. For most consistent results, schedule testing during the follicular phase (days 1-14 of the cycle).
Pregnancy profoundly alters insulin sensitivity, with normal pregnancy inducing a degree of physiologic resistance to ensure adequate glucose supply to the fetus. Women with a history of gestational diabetes or PCOS should pursue particularly vigilant screening given their elevated baseline risk.
Menopause often triggers metabolic changes, with many women experiencing increased central adiposity and worsening insulin sensitivity. Testing during the perimenopausal transition can catch these changes early.
Pediatric and Adolescent Screening
Childhood obesity has driven a dramatic increase in pediatric metabolic disease. The a JAMA review of adolescent obesity and its metabolic consequences reveals concerning trends in younger populations.
Testing becomes appropriate for children and adolescents with obesity, strong family history, signs of PCOS, or other risk factors. Reference ranges differ from adult values, requiring pediatric-specific interpretation.
Athletes and Active Individuals
Highly active individuals often have excellent insulin sensitivity and may achieve unusually low fasting insulin levels. However, overtraining syndrome can paradoxically worsen metabolic markers, making monitoring valuable for serious athletes.
Some athletes pursuing extreme low-carbohydrate diets develop "physiologic insulin resistance," where muscles become preferentially adapted to burning fat. This appears different from pathologic resistance and may not carry the same health risks, though research continues.
Beyond Insulin: Emerging Markers and Future Directions
The field of metabolic testing continues to evolve, with researchers identifying new markers and refining our understanding of disease mechanisms.
Promising New Biomarkers
Proinsulin represents the precursor molecule that the pancreas converts to insulin. Elevated proinsulin relative to insulin suggests pancreatic stress and predicts future beta cell failure. This marker may eventually become part of standard screening.
C-peptide measures insulin production directly, as it's released in equimolar amounts with insulin but has a longer half-life. C-peptide testing can distinguish between type 1 and type 2 diabetes and assess beta cell function.
Advanced glycation end products (AGEs) accumulate when proteins become glycated through exposure to excess glucose. AGE measurements may provide information about long-term metabolic damage beyond what A1C reveals.
Continuous glucose monitors (CGMs) offer unprecedented insight into glucose patterns throughout the day and night. While not traditional lab testing, CGM data reveals how individual foods, exercise, sleep, and stress affect glucose regulation in real-time.
Genetic and Personalized Testing
Genetic testing can identify variants that affect diabetes risk, insulin production, or metabolic efficiency. While we cannot change our genes, knowing genetic predispositions can guide more aggressive screening and prevention efforts.
Metabolomics-the study of small molecules produced by metabolism-promises to reveal subtle metabolic changes even earlier than current markers. As this technology becomes more accessible, it may revolutionize early detection.
The Power of Knowledge and Action
Understanding your metabolic health through comprehensive testing provides the information you need to make informed decisions about your health. Early detection of insulin-related dysfunction transforms an invisible problem into an actionable opportunity for prevention.
The tests are available, the science is clear, and the interventions work. What remains is individual action-the decision to pursue testing before problems become obvious, to interpret results with an eye toward optimal rather than merely normal values, and to implement proven interventions when testing reveals early dysfunction.
Every person with risk factors deserves access to the tests that reveal metabolic problems while they remain reversible. Fasting insulin and HOMA-IR testing catch dysfunction years before standard screening, during the window when lifestyle changes alone can completely prevent disease progression.
Your metabolic health trajectory is not predetermined. Testing reveals your current position, intervention changes your direction, and regular monitoring confirms your progress. The tools exist-the question is whether you'll use them.
Early detection through fasting insulin and HOMA-IR testing provides critical insights that standard screening misses, catching metabolic dysfunction when it's most treatable. Getting tested doesn't require insurance approvals or physician referrals when you use self-pay lab services. Justlabs offers convenient access to comprehensive metabolic panels with transparent pricing and results in 1-3 days, empowering you to take control of your health through proactive screening.