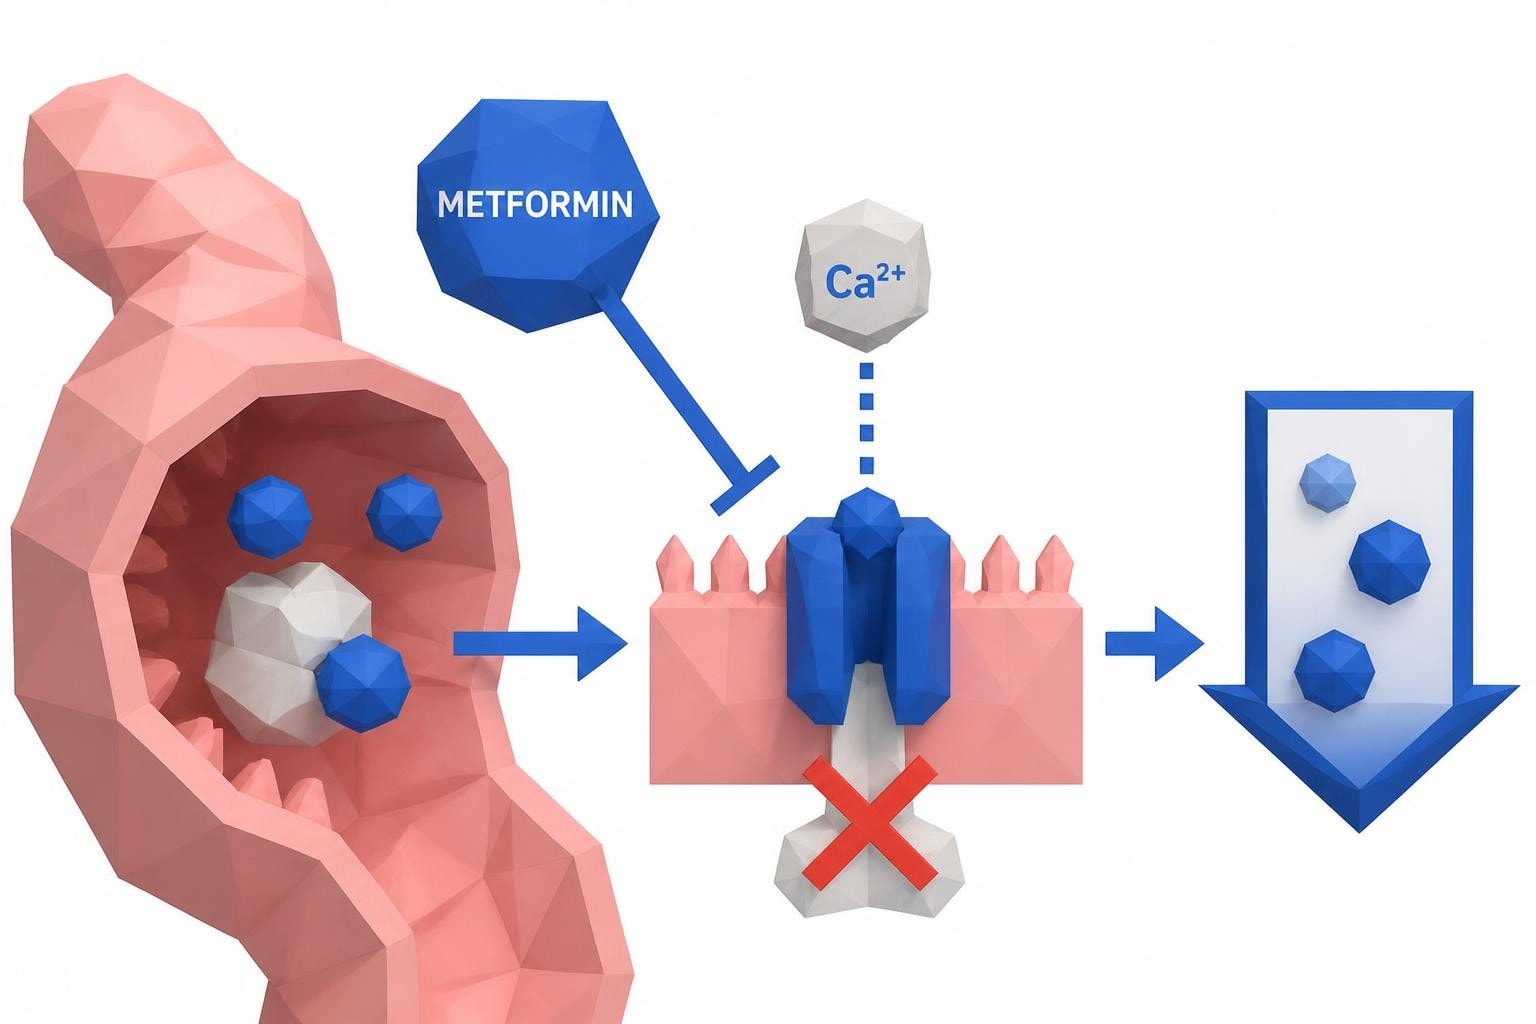
Understanding your health at a deeper level requires looking beyond standard annual checkups. Inside the longevity and aging panel, you'll find a comprehensive collection of biomarkers designed to evaluate multiple dimensions of health, from metabolic function to cardiovascular risk. These specialized tests provide insights that help you and your healthcare provider identify potential areas for optimization and further evaluation. While these panels cannot predict lifespan, they offer valuable information about biological processes that influence health span and overall wellness.
Understanding the Core Purpose of Longevity Testing
Modern longevity panels represent a shift from reactive to proactive healthcare. Traditional blood work typically screens for disease after symptoms appear, while comprehensive aging panels assess biological function before problems develop. Scope varies widely even among routine options, so knowing which markers a basic wellness panel includes versus a comprehensive one is a useful starting point before stepping up to longevity-focused testing. The goal is identifying actionable data points that suggest where interventions might be beneficial.
Inside the longevity and aging panel framework, biomarkers are selected based on their association with age-related conditions and their responsiveness to lifestyle modifications. These markers span multiple body systems because aging affects everything from cellular energy production to immune function. When ordering labs without a doctor, you gain the ability to track these metrics proactively and establish your personal baseline.

Metabolic Health Markers
Fasting Glucose measures blood sugar levels after an overnight fast, providing insight into how effectively your body regulates glucose. Elevated fasting glucose, even within "normal" ranges, may indicate insulin resistance developing years before diabetes diagnosis. Optimal ranges are tighter than standard reference ranges, typically below 90 mg/dL for longevity-focused protocols.
Hemoglobin A1c (HbA1c) reflects average blood sugar over the previous two to three months. This marker captures glucose patterns that single fasting measurements might miss, revealing sustained elevations that damage blood vessels and accelerate aging processes. Values below 5.3% are considered optimal for longevity.
Fasting Insulin is often overlooked in standard panels but provides critical information about metabolic health. Insulin resistance begins with elevated insulin levels while glucose remains normal, a phenomenon called hyperinsulinemia. Inside the longevity and aging panel, fasting insulin levels above 5 μIU/mL may warrant dietary and lifestyle interventions even when glucose appears normal.
| Metabolic Marker | Standard Range | Optimal Longevity Range | What It Reveals |
|---|---|---|---|
| Fasting Glucose | 70-99 mg/dL | 70-90 mg/dL | Glucose regulation efficiency |
| HbA1c | Below 5.7% | Below 5.3% | Long-term glucose control |
| Fasting Insulin | 2-25 μIU/mL | 2-5 μIU/mL | Early insulin resistance |
Cardiovascular Risk Assessment
Cardiovascular disease remains a leading cause of mortality, making heart health markers essential components inside the longevity and aging panel. Advanced lipid testing goes far beyond standard cholesterol measurements to assess particle size, count, and atherogenic potential.
Apolipoprotein B (ApoB) counts the number of atherogenic lipid particles circulating in your blood. Unlike LDL cholesterol, which measures cholesterol content, ApoB quantifies actual particle number. Since each particle can contain varying amounts of cholesterol, longevity blood panels prioritize ApoB as a superior predictor of cardiovascular risk.
Lipoprotein(a) [Lp(a)] is a genetically determined lipid particle that significantly increases cardiovascular risk. Elevated Lp(a) affects approximately 20% of the population and remains largely unaffected by diet or exercise. Testing this marker once provides lifelong information since levels remain stable throughout adulthood.
Advanced Lipid Biomarkers
- Total Cholesterol: Provides overall lipid status but limited predictive value alone
- HDL Cholesterol: Higher levels generally protective, though functionality matters more than quantity
- LDL Cholesterol: Calculated or direct measurement of primary atherogenic particle
- Triglycerides: Elevated levels indicate metabolic dysfunction and increased cardiovascular risk
- ApoA1: The primary protein in HDL particles, indicating reverse cholesterol transport capacity
High-sensitivity C-Reactive Protein (hs-CRP) measures systemic inflammation, a key driver of cardiovascular disease and accelerated aging. Values below 1.0 mg/L are optimal, while levels above 3.0 mg/L indicate significantly elevated risk. This marker responds to lifestyle interventions, making it valuable for tracking intervention effectiveness.
Inflammatory and Immune Markers
Chronic low-grade inflammation, termed "inflammaging," characterizes biological aging across multiple organ systems. Inside the longevity and aging panel, inflammatory markers help identify this silent process before it manifests as disease.
Homocysteine is an amino acid that accumulates when B-vitamin metabolism is impaired. Elevated levels damage blood vessel walls, promote inflammation, and increase cardiovascular and neurodegenerative disease risk. Optimal levels below 8 μmol/L can typically be achieved through B-vitamin supplementation when elevated.
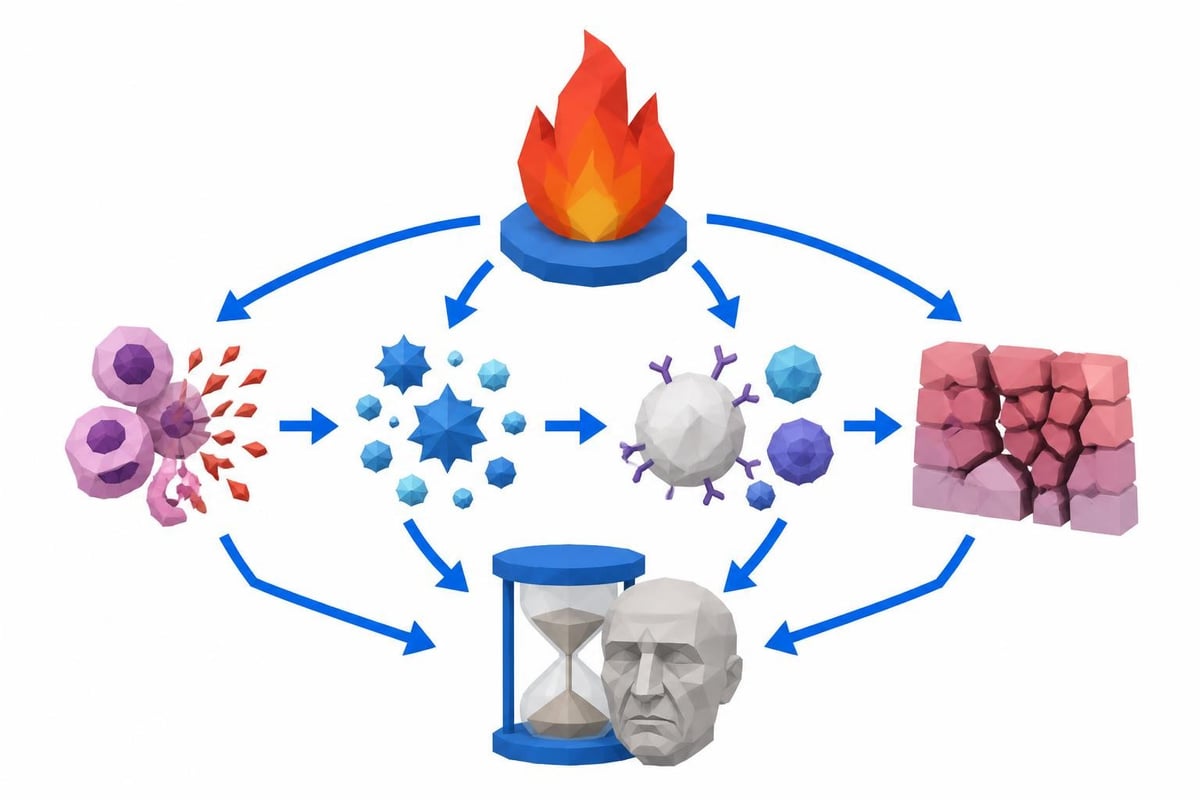
Complete Blood Count (CBC) with differential provides comprehensive immune system assessment. While not glamorous, these measurements reveal important information:
- White blood cell count and differential indicate immune activation and inflammation
- Red blood cell indices detect anemia, which impacts oxygen delivery and energy production
- Platelet counts affect clotting risk and inflammatory signaling
Thyroid Function Assessment
Thyroid hormones regulate metabolism, energy production, and cellular turnover throughout the body. Suboptimal thyroid function accelerates aging through multiple mechanisms.
Thyroid Stimulating Hormone (TSH) indicates how hard your pituitary gland is working to stimulate thyroid hormone production. Values within standard reference ranges (0.4-4.0 mIU/L) may still be suboptimal, with longevity-focused practitioners preferring TSH between 0.5-2.0 mIU/L.
Free T4 and Free T3 measure actual circulating thyroid hormones available to cells. T4 is the storage form, while T3 is the active hormone. Some individuals convert T4 to T3 inefficiently, making both measurements valuable inside the longevity and aging panel framework.
Nutritional Status and Micronutrients
Optimal vitamin and mineral status supports countless enzymatic reactions, DNA repair mechanisms, and antioxidant systems that protect against aging. These longevity biomarkers often reveal deficiencies even in people consuming seemingly adequate diets.
Vitamin D (25-hydroxyvitamin D) functions more like a hormone than a vitamin, influencing immune function, bone health, cardiovascular health, and cellular aging. Despite widespread supplementation, deficiency remains common. Optimal levels for longevity range from 40-60 ng/mL, higher than the minimum 30 ng/mL needed to prevent bone disease.
Vitamin B12 is essential for DNA synthesis, nervous system function, and red blood cell production. Deficiency increases with age due to decreased stomach acid production and medication interactions. Values above 500 pg/mL are preferred, as standard reference ranges include marginal deficiency states.
| Nutrient Marker | Standard Range | Optimal Range | Function in Aging |
|---|---|---|---|
| Vitamin D | 30-100 ng/mL | 40-60 ng/mL | Immune function, bone health, cellular signaling |
| Vitamin B12 | 200-900 pg/mL | 500-900 pg/mL | DNA synthesis, nerve function, homocysteine metabolism |
| Folate | 3-17 ng/mL | Above 10 ng/mL | DNA methylation, homocysteine metabolism |
| Magnesium | 1.7-2.2 mg/dL | 2.0-2.6 mg/dL | Energy production, hundreds of enzymatic reactions |
Folate works synergistically with B12 in one-carbon metabolism pathways essential for DNA methylation, a key process in biological age assessment. Inadequate folate impairs DNA repair and increases homocysteine levels.
Magnesium participates in over 300 enzymatic reactions, including energy production, DNA repair, and protein synthesis. Serum magnesium testing has limitations since the body maintains blood levels at the expense of tissue stores, but low-normal values often indicate deficiency.
Kidney and Liver Function Markers
Organ function assessment provides critical information about detoxification capacity and metabolic processing. Declining kidney and liver function accelerates aging through toxin accumulation and impaired nutrient metabolism.
Kidney Function Panel
Inside the longevity and aging panel, kidney markers assess filtration capacity and electrolyte balance:
- Creatinine: Waste product filtered by kidneys; elevated levels indicate reduced function
- Blood Urea Nitrogen (BUN): Another waste product; ratio to creatinine provides additional insights
- Estimated Glomerular Filtration Rate (eGFR): Calculated value estimating kidney filtration capacity
- Electrolytes (Sodium, Potassium, Chloride): Balance indicates kidney regulation and hydration status
Uric Acid deserves special attention in longevity testing. While traditionally associated with gout, elevated uric acid increases cardiovascular disease risk, promotes insulin resistance, and may accelerate cellular aging. Optimal levels range from 3.5-5.5 mg/dL, lower than standard reference ranges.
Liver Function Assessment
The liver performs hundreds of functions essential for healthy aging, from detoxification to protein synthesis. Key enzymes reveal cellular health and metabolic stress:
Alanine Aminotransferase (ALT) and Aspartate Aminotransferase (AST) leak from liver cells when damaged. Inside the longevity and aging panel context, even mildly elevated values may indicate fatty liver disease, a condition affecting over 25% of adults and strongly linked to metabolic dysfunction.
Albumin and Total Protein measure liver synthesis capacity and nutritional status. Low albumin, even within normal ranges, associates with frailty and increased mortality in older adults.
Protein Status and Metabolic Indicators
Albumin to Globulin Ratio provides insights into protein balance, immune activation, and chronic disease risk. Low ratios may indicate chronic inflammation, liver dysfunction, or kidney disease developing before standard markers become abnormal.
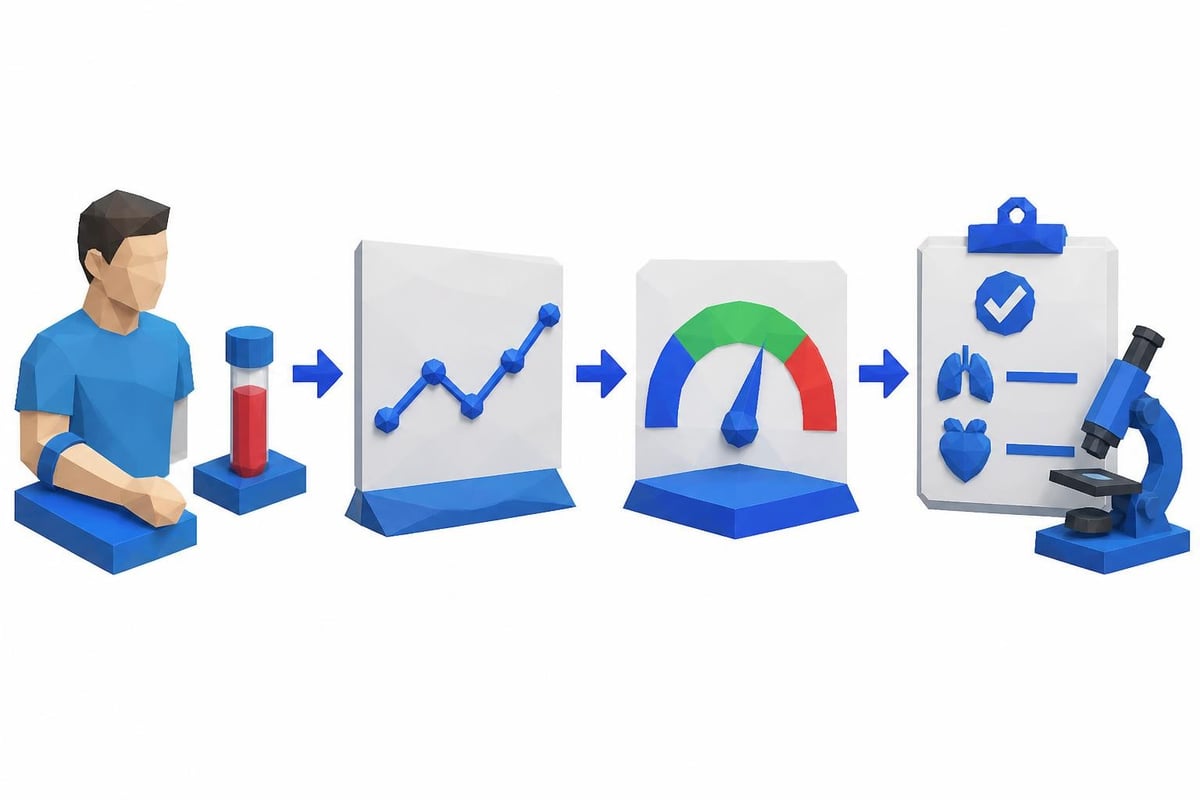
Total Protein reflects both liver synthesis capacity and immune system activity. Values outside optimal ranges warrant investigation into underlying causes rather than representing standalone diagnostic information.
Sex Hormones and Aging
Hormonal changes profoundly affect aging processes in both men and women. Declining hormone levels contribute to muscle loss, bone density reduction, metabolic changes, and cardiovascular risk.
Testosterone (total and free) matters for both sexes, though at different levels. In men, declining testosterone accelerates sarcopenia, increases cardiovascular risk, and impairs metabolic health. Women produce less testosterone but still require adequate levels for muscle maintenance and metabolic function.
Estradiol assessment in women reveals reproductive aging status and helps evaluate osteoporosis risk. In men, excessive estradiol conversion from testosterone may indicate increased aromatase activity or excess body fat.
Hormone Assessment Considerations
- Timing matters: Test testosterone and cortisol in the morning when levels peak
- Single measurements provide snapshots; trends over time reveal more
- Reference ranges are broad; optimal levels vary individually
- Hormone replacement requires medical supervision and regular monitoring
Making Sense of Your Results
Understanding what's inside the longevity and aging panel is just the beginning. Interpreting results requires context about your age, sex, lifestyle, medications, and health goals. Standard reference ranges represent the middle 95% of tested populations, which increasingly includes unhealthy individuals.
Longevity-focused interpretation compares your values to optimal ranges associated with healthy aging rather than just excluding disease. A fasting glucose of 95 mg/dL is "normal" but suboptimal for metabolic health. An hs-CRP of 2.5 mg/L isn't flagged as abnormal but indicates significant inflammatory burden.
Comprehensive blood diagnostics designed for longevity assessment use tighter ranges based on outcomes research rather than population averages. This approach identifies opportunities for intervention before disease develops.
Taking Action Based on Biomarker Data
Testing provides information; action creates change. Inside the longevity and aging panel results, you'll find specific areas where lifestyle modifications, supplementation, or medical interventions may prove beneficial.
Elevated inflammatory markers respond to:
- Dietary changes emphasizing anti-inflammatory foods
- Exercise that balances intensity with adequate recovery
- Stress management and sleep optimization
- Potential supplementation with omega-3 fatty acids, curcumin, or other anti-inflammatories
Suboptimal metabolic markers improve through:
- Carbohydrate quality and quantity adjustment
- Time-restricted eating or other dietary timing strategies
- Resistance training to improve insulin sensitivity
- Weight management when excess body fat is present
Nutrient deficiencies typically require:
- Targeted supplementation at therapeutic doses
- Addressing absorption issues when present
- Retesting after 2-3 months to confirm repletion
- Dietary modifications for long-term maintenance
The complete list of longevity biomarkers extends beyond what any single panel measures, but comprehensive testing establishes a foundation for tracking health over time. Regular monitoring every 6-12 months reveals trends and confirms whether interventions are working.
Accessing Longevity Testing Without Barriers
Traditional healthcare often creates barriers to comprehensive testing through insurance requirements, physician gatekeeping, and unclear pricing. When you can order labs without a doctor, you remove these obstacles and gain control over your health data.
Self-directed testing allows you to:
- Establish baseline values before symptoms develop
- Track biomarkers more frequently than annual checkups allow
- Verify supplement and lifestyle intervention effectiveness
- Share comprehensive data with healthcare providers for informed discussions
Transparent pricing eliminates insurance complexity and makes testing accessible regardless of coverage status. Understanding costs upfront allows budgeting for regular monitoring rather than hoping insurance approves comprehensive panels.
Limitations and Appropriate Expectations
Inside the longevity and aging panel, you won't find a crystal ball predicting lifespan or a single number representing biological age. These tests identify areas for further evaluation and optimization rather than providing definitive diagnoses or guarantees.
Biomarkers exist within complex biological systems where multiple factors interact. An elevated marker may indicate:
- Actual dysfunction requiring intervention
- Temporary elevation from recent illness, exercise, or stress
- Laboratory variation or measurement error
- Individual variation within healthy ranges
Professional interpretation remains valuable even with self-directed testing. Sharing results with knowledgeable healthcare providers ensures comprehensive evaluation and appropriate follow-up when abnormalities appear. Avoid self-diagnosing or implementing major interventions without professional guidance.
Testing frequency matters for different biomarkers. Some change rapidly (glucose, insulin), while others remain stable for months or years (Lp(a), vitamin D after repletion). Overtesting wastes resources, while undertesting misses important changes.
Building Your Personal Longevity Strategy
Inside the longevity and aging panel framework, testing serves as one component of a comprehensive approach to healthy aging. The most powerful interventions remain lifestyle-based: nutrition, exercise, sleep, stress management, and social connection.
Biomarker tracking helps you:
- Identify priorities: Focus interventions on areas showing the most need
- Measure progress: Confirm that changes are producing desired effects
- Maintain motivation: Seeing improvements reinforces healthy behaviors
- Catch problems early: Detect trends before they become diseases
- Optimize continuously: Refine approaches based on individual responses
Consider working with practitioners who understand longevity medicine and can help interpret results in context with your goals. This might include functional medicine physicians, longevity-focused health coaches, or preventive cardiologists specializing in advanced lipid testing.
Understanding what information FSA and HSA accounts cover for testing helps maximize healthcare dollars. Many longevity panels qualify for tax-advantaged spending when deemed medically appropriate.
Inside the longevity and aging panel, you'll discover comprehensive biomarker assessment spanning metabolic function, cardiovascular risk, inflammation, nutritional status, and organ function-information that empowers proactive health optimization. When you're ready to establish your baseline and track these critical markers over time, JustLabs provides affordable, transparent access to comprehensive testing with results delivered in 1-3 days, no insurance or doctor's visit required.